
Figure 6.
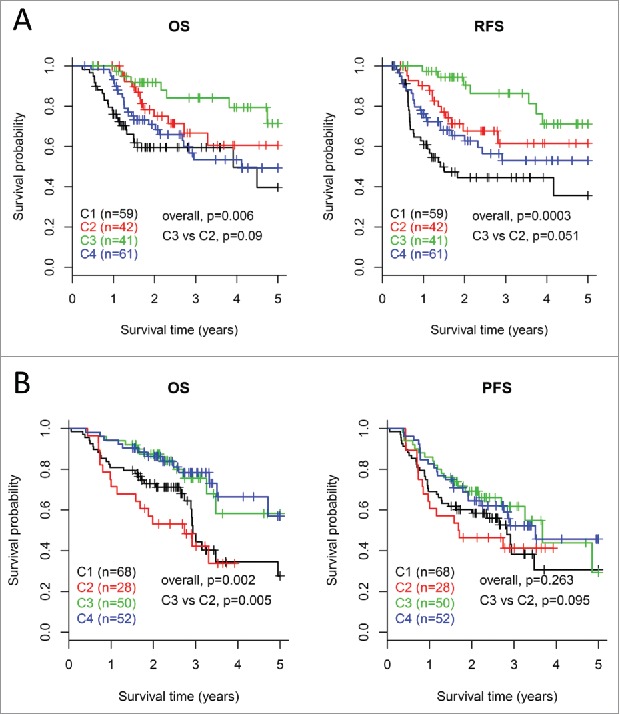
Survival analysis for the four subtypes of HNSCCs. Kaplan-Meier curves show the distinct outcome of patients in the four subtypes respectively. The p value was calculated by the log-rank test, by comparing the overall four subtypes together or subtype C3 versus subtype C2 only. Results are represented for TCGA cohort (A) and the LHNG cohort (B), respectively.