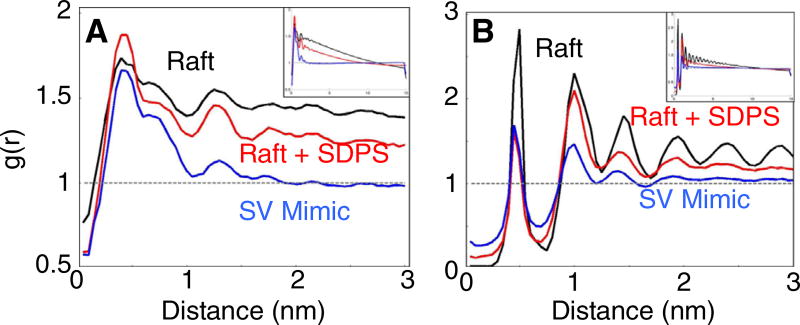
Fig. 2.
Cholesterol radial distributions. (A) Radial distribution plots between the cholesterol OH group and the phosphate bead of DPPC are displayed for the raft mixture (black) the raft + SDPS mixture (red), and the SV mimic mixture (blue). (B) Radial distribution plots between cholesterol molecules in each system. Each RDF is a time average from 5 to 5.5 µs of simulation time. The full-length (15 nm) radial distribution plots are shown as insets.

