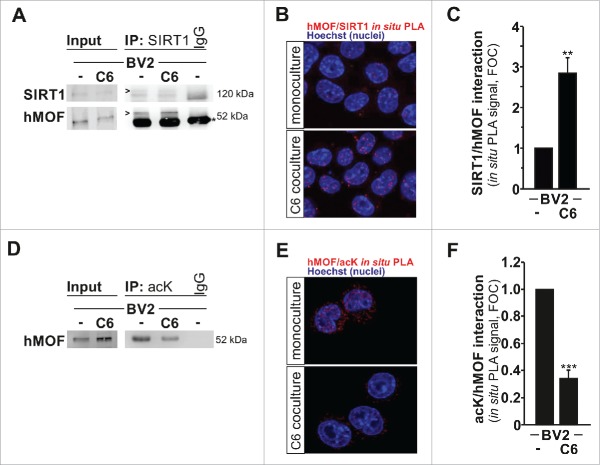
Figure 5.
SIRT1 interacts with and deacetylates hMOF. (A) Immunoblot analysis of SIRT1 and hMOF in BV2 microglia cultured for 4 h as monoculture or with C6 glioma cells as segregated coculture assessed after immunoprecipitation with antibody to SIRT1 or immunoglobulin G (IgG; control). IgG bands are indicated with an asterisk, whereas proteins of interest are indicated with an arrow head. (B) In situ proximity-ligation assay (PLA) with quantifications (C) of SIRT1-hMOF interactions in BV2 microglia grown for 4 h as monocultures or with C6 cells as segregated cocultures; results are presented relative to those of BV2 monocultures, set as 1. (D) Immunoblot analysis of hMOF in BV2 microglia cultured for 4 h as monoculture or with C6 glioma cells as segregated coculture assessed after immunoprecipitation with antibody to acetyl lysine (acK) or immunoglobulin G (IgG; control). (E) In situ proximity-ligation assay (PLA) with quantification (F) of acK-hMOF interactions in BV2 microglia grown for 4 h as monocultures or with C6 cells as segregated cocultures; results are presented relative to those of BV2 monocultures, set as 1. **P < 0.01and ***P < 0.001 (two-tailed Student's t-test). Data are from three independent experiments (mean and s.d.).

