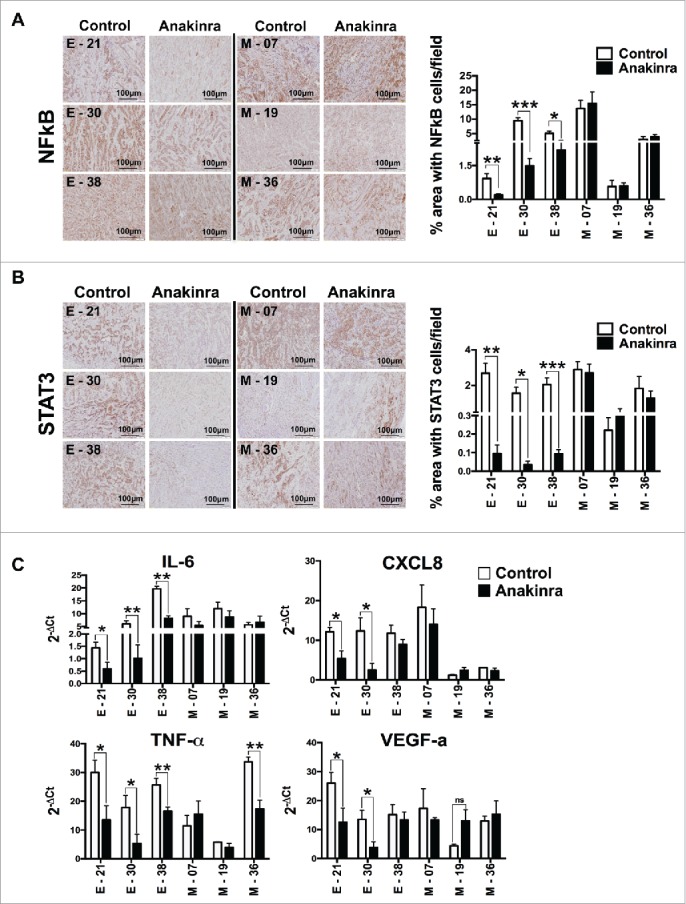
Figure 4.

IL-1R antagonist reduces NF-κB p65 and STAT3 phosphorylation in only K-Raspancreatic tumors with epithelial phenotype. Representative immunohistochemistry image of tumors from epithelial cell lines (E-21, E-30, E-38) and mesenchymal cell lines (M-7, M-19, M-36) treated or not with Anakinra as detailed in the legend of Fig. 3. (A) NF-κB p65 phosphorylation, and (B) STAT3 phosphorylation (Tyr 705). Scale bar = 100 mm. Graphs at right side indicate quantification of stained area. Bars indicate mean +/-SD of 5 sections/tumor, 3–5 tumors per group). Student's t test *P<0.05, **P<0.01, ***P<0.001. (C) mRNA expression level of inflammatory mediators in the tumor microenvironment by real-time qPCR. Bars, mean +/-SD. *P<0.05, **P<0.01 for difference between control and Anakinra treated group.
