
Figure 2.
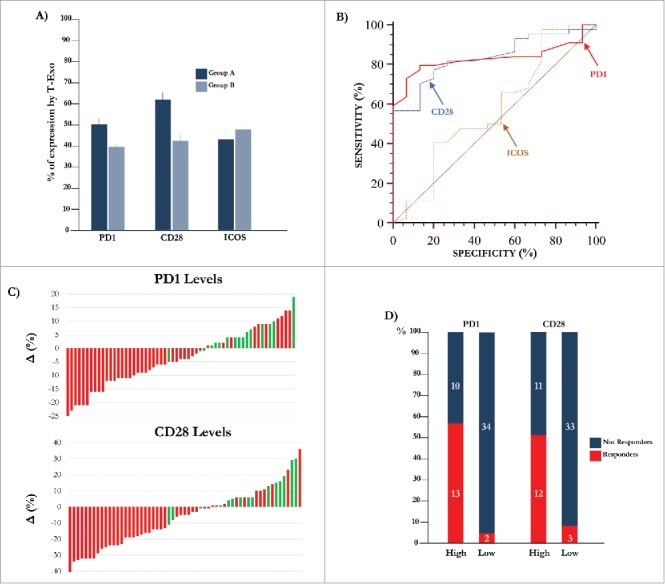
Expression of molecular immune checkpoints by T-Exo in MM population. (A) Levels of PD-1 (51.0±1.4%) and CD28 (62.6±3.0%) positive T-Exo were increased in groups A (p<0.0001) with respect to B (39.4±1.5% and 42.6±2.5%). By contrast, ICOS levels were almost similar. Bars are means±SEM (standard error of the mean). (B) Statistical analysis was completed to define the basal cut-off values of PD-1, CD28 and ICOS for exploring the meaning of their variation in MM population. As shown, the ROC curve analysis revealed a sensitivity and specificity equal to 79.5% and 86.7% for PD-1 (red line) while the values of CD28 (blue line) were 77.3% and 80%, respectively. A significant cut-off value for ICOS was not identified (yellow line). (C) Waterfall plots graphically represent the trend of PD-1 (up) and CD28 (down) levels with respect to basal cut-off in MM population treated with IPI. Green bars represent patients who achieved a response (CR, PR, SD) with respect to those showing PD (red bars). (D) The response of patients with high (n = 23) or low (n = 36) PD-1 and CD28 levels are represented. The 56.5% (n = 13) of patients with high PD-1 showed a clinical benefit as compared to only 5.5% of those with low levels (n = 2; p<0.0001). Similarly, 52% of patients with high CD28 levels showed a response (n = 12) with respect to the 8% (n = 3) characterized by low levels (p = 0.0004). Bars are percentage of patients divided in responders (red) and not-responders (blue).