
Figure 3.
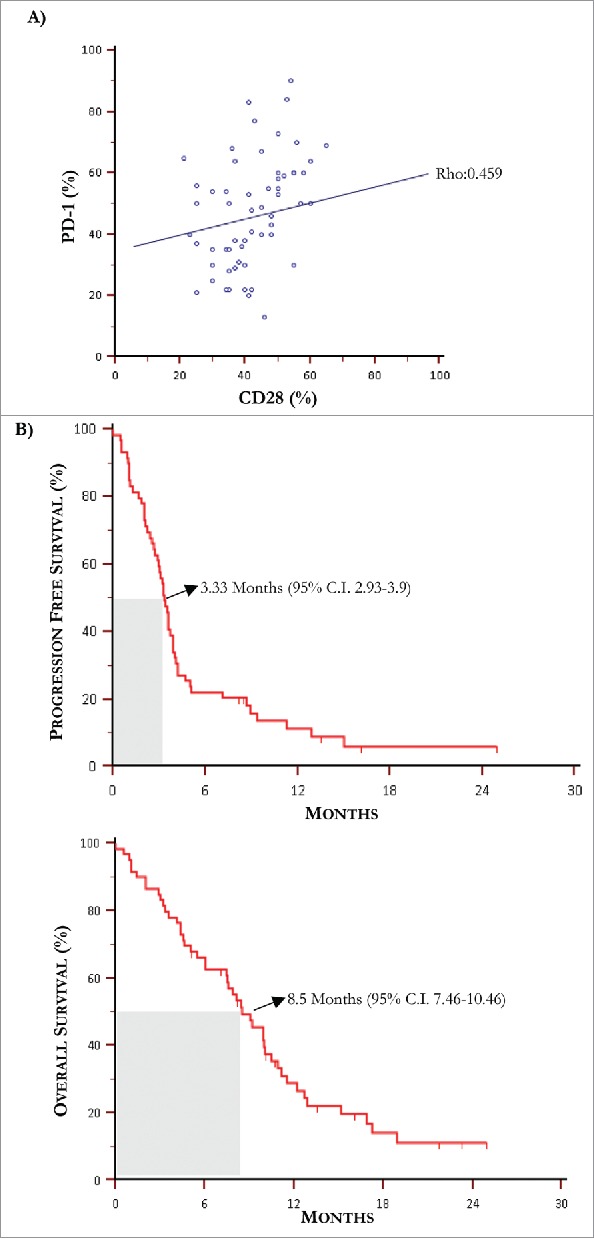
Kaplan-Meier curves for progression free survival and overall survival. (A) The Spearman's rank test revealed a positive correlation between PD-1 and CD28 levels of expression by T-Exo from MM population (rho: 0.459, p = 0.0003). (B) Median PFS and OS in MM population treated with IPI were 3.3 months and 8.5 months, respectively.