
Figure 4.
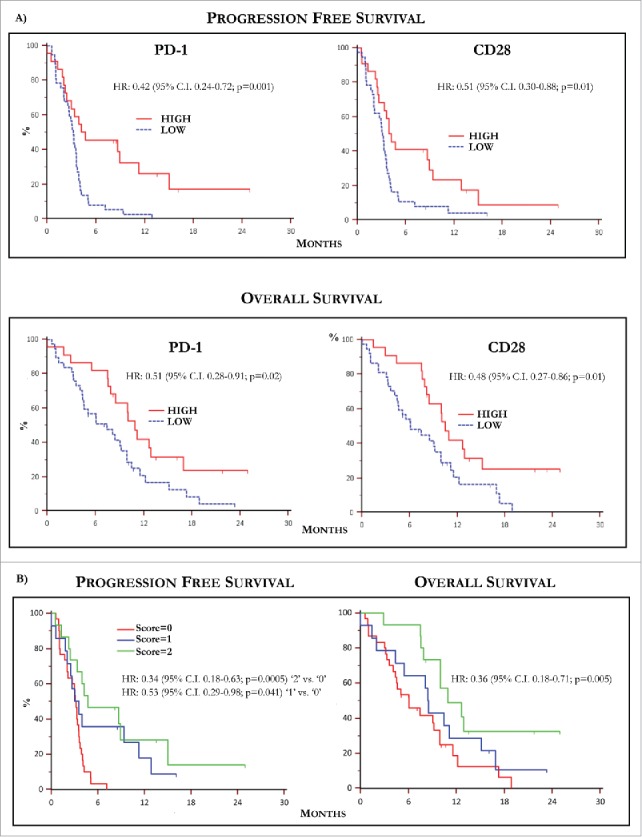
Kaplan-Meier curves by PD-1 and CD28 levels and predictive score. (A) Kaplan-Meier curves showing PFS (up) relative to PD-1 (left) and CD28 (right) levels in MM population. Patients with high basal PD-1 and CD28 T-Exo levels underwent increased PFS with respect to those with low expression of both receptors. The relative HR was 0.42 (95% C.I. 0.24-0.72) and 0.51 (95% C.I. 0.30-0.88), respectively (p < 0.05 in both instances). The OS (down) was similarly prolonged in patients bearing high basal PD-1 (HR:0.51, 95% C.I. 028-0.91) and CD28 (HR:0.48; 95% C.I. 0.27-0.86) expression (p < 0.05 in both instances). (B) PFS (left) and OS (right) calculated with respect to a predictive score calculated in relation to the basal values of PD-1 and CD28 higher or lower with respect to the cut-off. The study population was scored as follows: ‘0’ (n = 30; 50.8%), ‘1’ (n = 14; 23.7%), ‘2’ (n = 15; 25.4%). Median PFS and OS were 3.15 (95% CI: 2.03 to 3.57) and 6.06 months (95% CI: 4.1 to 9.9) in patients scored ‘0’, 3.56 (95% CI: 2.03 to 11.3) and 8.5 months (95% CI: 4.36 to 15.13) in those scored ‘1’ and 4.74 (95% CI, 3.33 to 15.00) and 10.93 months (95% CI, 10.0 to 12.9) in score ‘2’. Therefore, PFS (HR: 0.34, 95% C.I. 0.18-0.63; p = 0.0005) and OS (HR: 0.36, 95% C.I. 0.18- 0.71; p = 0.005) were significantly longer in score ‘2’ as compared to ‘0’, whereas a weak trend to significance in terms of median PFS occurred in ‘1’ (HR: 0.53, 95% C.I. 0.29-0.98; p = 0.041) with respect to ‘0’ without significant difference in terms of OS (p = 0.35). Finally, there was not significant difference in terms of PFS and OS between patients scored as ‘1’ or ‘2’. Score ‘2’: PD-1 hig/CD28 high; score ‘1’: PD-1 or CD28 high; score ‘0’: PD-1 and CD28 low. High and low levels were established in relation to values of ROC curves.