
Figure 5.
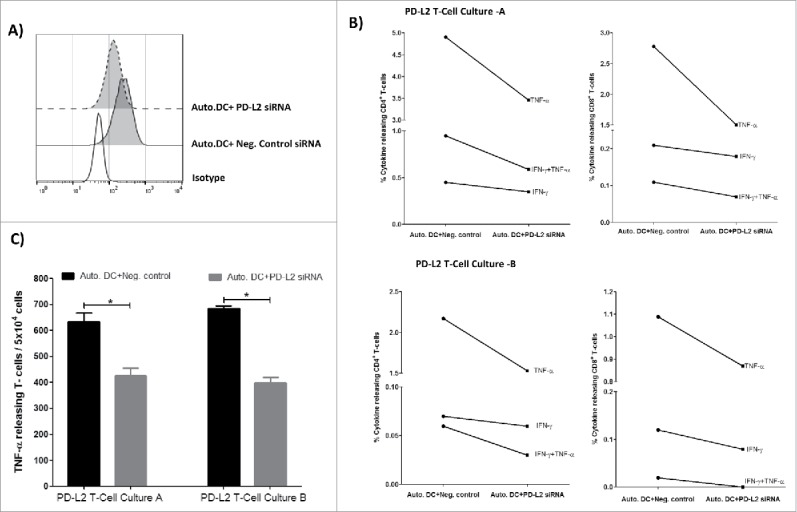
PD-L2 dependent reactivity towards DCs. (A) Flow cytometric analysis showing profile of PD-L2 surface expression on autologous DCs transfected with either PD-L2 siRNA or negative control siRNA, 48hr after electroporation. (B) PD-L2T-cells culture-A (top) and PD-L2T-cells culture-B (bottom) were stimulated with autologous DCs transfected PD-L2 siRNA or negative control siRNA for 5 hours at a ratio of 1:5 (DC:T-cell). Percentage of cytokine releasing CD4+ T cells (left) and CD8+ T cells (right) was measured using intracellular cytokine staining. (C) Number of TNF-α releasing T cells in PD-L2 cultures in response to autologous DCs transfected with either a negative control siRNA (black bars) or PD-L2 siRNA (grey bars) measured at 48 hours after electroporation using ELISPOT assay. The assay was performed in triplicate and * denotes significant according to the DFR.