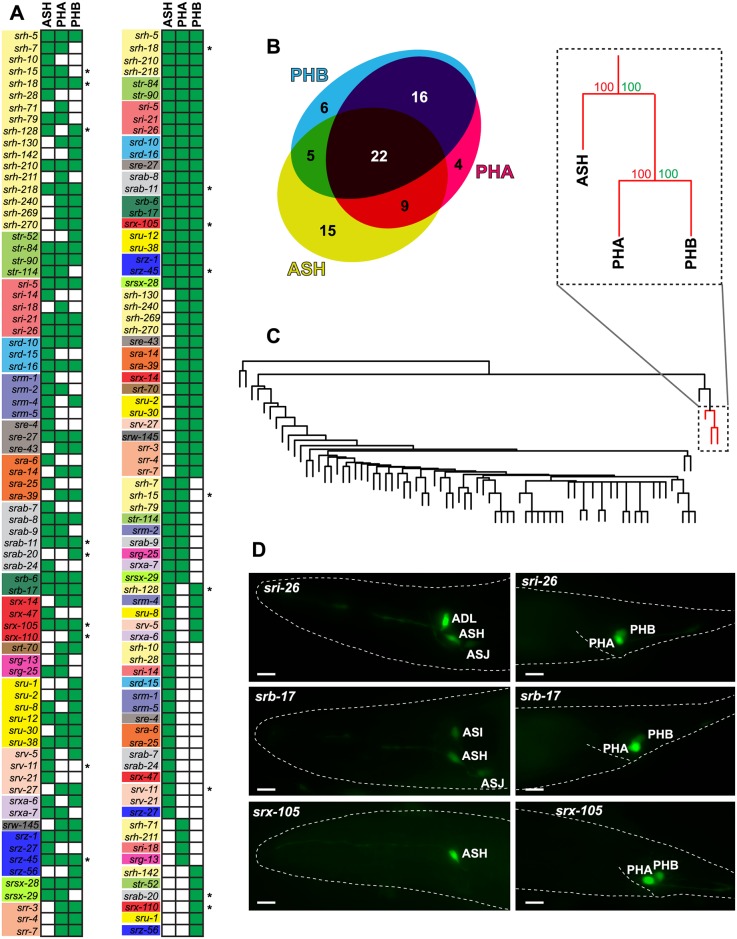
Fig 4. The only coexpression association of csGPCR reporters is in nociceptive neurons.
(A,B) Graphical representation of ASH, PHA, and PHB coexpression. Green-filled square indicates expression. An asterisk denotes that the gene is exclusively expressed in the indicated neurons. Venn diagram was created with eulerAPE [57]. (C) Hierarchical clustering of neurons by GPCR reporter expression. Red lines show the well-supported ASH, PHA and PHB cluster (AU > 95%). BP values (in green) are listed in percentages.(D) Examples of reporter gene expression profiles in ASH/PHA/PHB. Young adult hermaphrodites are shown. Scale bars, 10 μm. AU, approximately unbiased p-value; BP, bootstrap probability value; GPCR, G-protein-coupled receptor.

