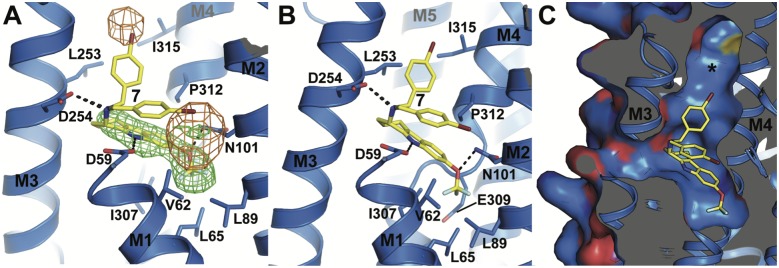
Fig 5. The binding pocket of compound 7.
A) Compound 7 with polar and hydrophobic interactions and mFo-DFc difference electron density map before the ligand was modeled (green, contoured at 3 σ) and anomalous difference map (orange, contoured at 4.5 σ, calculated using phases of the final refined model and anomalous difference data from 56–6 Å resolution). B) Slightly rotated view of the ligand binding site, revealing the position of the functionally important residue E309 in SERCA. C) Close-up view of the mostly uncharged surface of the ligand-binding site and its extension towards the P-domain (asterisk). Carbon atoms are colored blue in SERCA and yellow in 7, oxygen red, nitrogen blue, bromine dark red, and fluorine in pale cyan.

