
FIGURE 2.
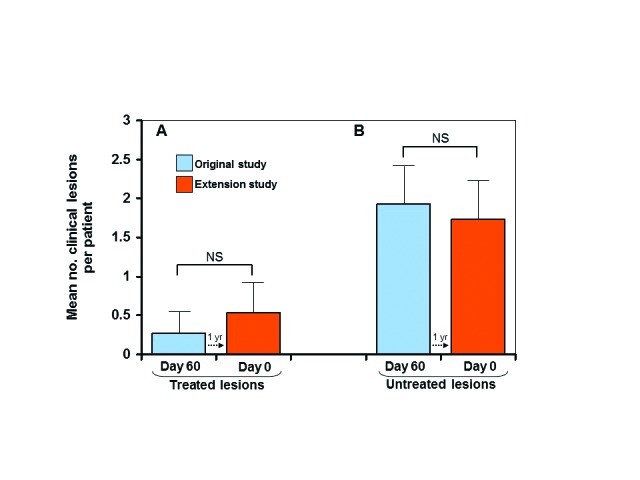
Maintenance of clearance—mean number of clinical lesions per patient at 60 days after treatment in the original study vs Day 0 of the extension study (A); mean number of clinical lesions per patient at 60 days after no treatment in the original study vs Day 0 of the extension study (B); dotted arrows indicate 1 -year transition from Day 60 of the original study to Day 0 of the extension study; error bars=95% confidence interval; NS=not significant