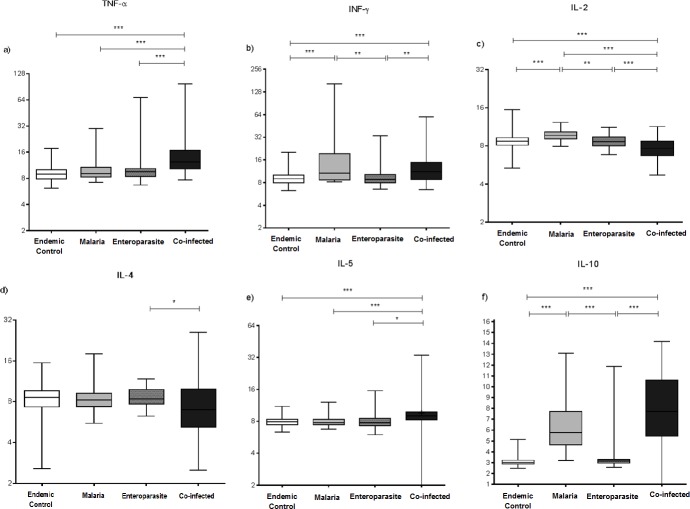
Fig 3.
Serum levels of TNF-α (a), IFN-γ (b), IL-2 (c), IL-4 (d), IL-5 (e) and IL-10 (f) cytokines in pg/mL among the following groups: endemic control, malaria, enteroparasite and co-infected groups. Multiple correlations were made using the non-parametric Kruskal-Wallis test followed by the Dunn's post hoc test. Data are expressed in box plot format (minimum to maximum values, P25%–P75% and median). Significant differences were estimated using the median values for each group, with p < 0.05 being considered significant. * p = 0.05, ** p < 0.05 and *** p = 0.001.

