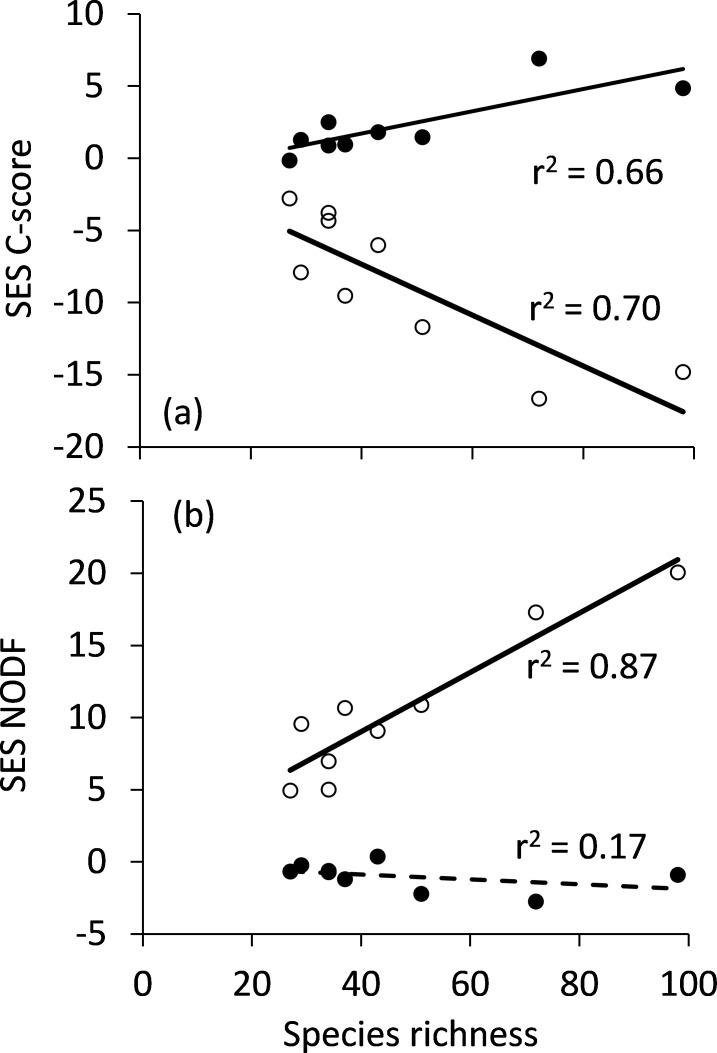
Fig 3.
The degree of species segregation (C-score, a) and nestedness (NODF, b) quantified by the standardised effect sizes SES of the equiprobable (open dots) and the fixed–fixed (black dots) null models in dependence on species richness in nine shifting windows of 20 caves each. Full linear OLS regressions a) and b): permutation P < 0.01, Broken regression line in b): permutation P > 0.10.

