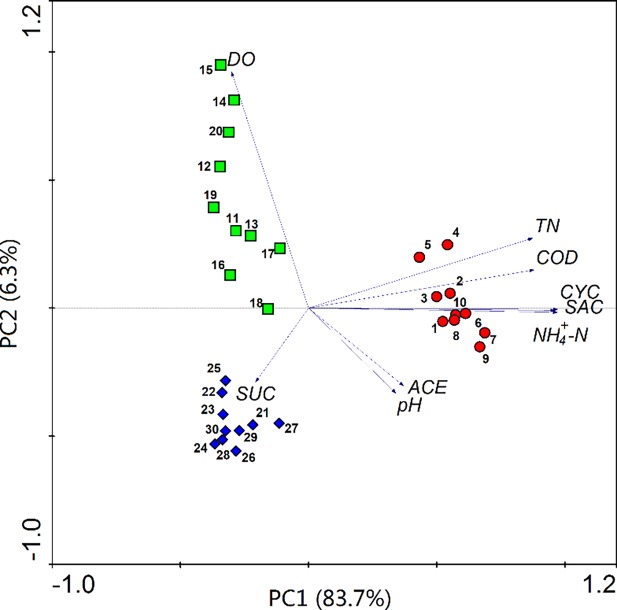
Fig 4. PCA analysis of ASs concentration and other physico-chemical indexes (data from winter) in influent (red circle, 1–10), secondary effluent (green square, 11–20) and effluent (blue diamond, 21–30).
Each object is a data vector of the 9 following variables: pH, DO, COD, NH4+-N, TN, ACE, CYC, SAC and SUC.

