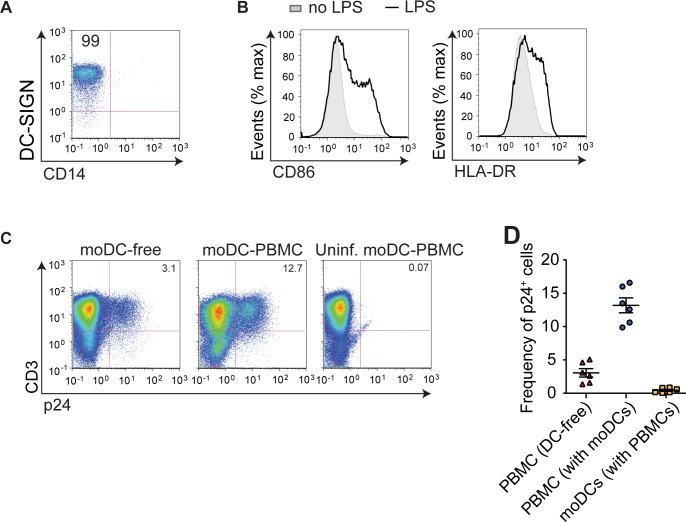
Fig 1. moDCs significantly amplify PBMC infection.
(A, B) moDCs were treated with LPS and analyzed by flow cytometry. FACS histogram plots showing expression of DC-SIGN and CD14. Number in the top left gate indicates percentage of CD14-DC-SIGN+cells (A). FACS histogram plots showing surface expression of activation markers CD86 and HLA-DR (B). (C) Infection of PBMCs without (left) or with DCs (center) was analyzed by flow cytometry. Uninfected moDC-PBMC coculture (right) was included as a negative control. Number in the top right gate indicates percentage of infected T cells. (D) Frequency of infected p24+ T cells or moDCs was measured in DC-free culture or moDC-PBMC cell coculture. Each symbol represents one donor. Mean ± s.e.m (η = 6 donors). ***, p <0.0001 (student’s T-test). Data is representative of two independent (A, B), six independent (C) or pooled from six independent experiments (D).

