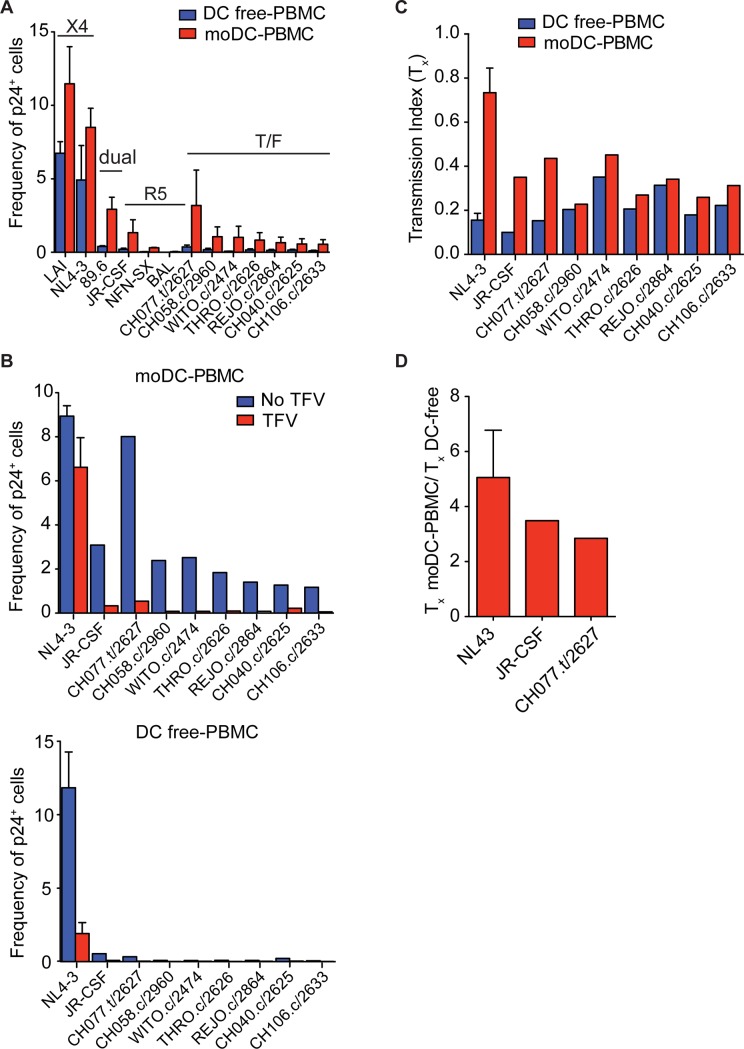
Fig 6. DC amplification of T cell infection with different HIV-1 isolates.
(A) Infection of PBMCs with or without moDCs by CXCR4-tropic, dual-tropic, CCR5-tropic and T/F isolates, which were normalized to similar amounts of p24, were analyzed by flow cytometry. Frequency of p24+ T cells was measured by flow cytometry. (B, C) PBMCs with or without moDCs were infected with or without 10 μM of TFV and drug insensitivity (Tx) (B) and fold difference between the Tx values were measured (C). Mean ± s.e.m (η = 2 donors). Data is representative of three independent experiments (A-C).

