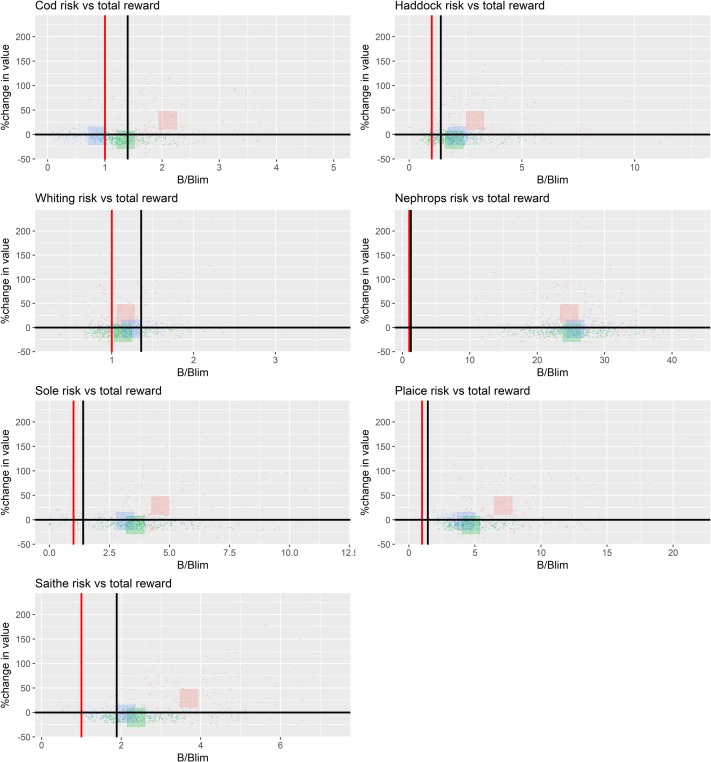
Fig 8. Contrast in risk by stock and total reward (combined value of the species in the NSMAP across all fleets) between 3 strategies.
Strict no discards (red), discard avoidance (green), discard continues (blue). The red vertical line in each pane shows Blim and the black line in MSY BTrigger. Each small point represents an outcome for a single parameterisation from the full set coloured by strategy implemented. The large squares show the mean response averaged across parameterisations and coloured by strategy implemented.

