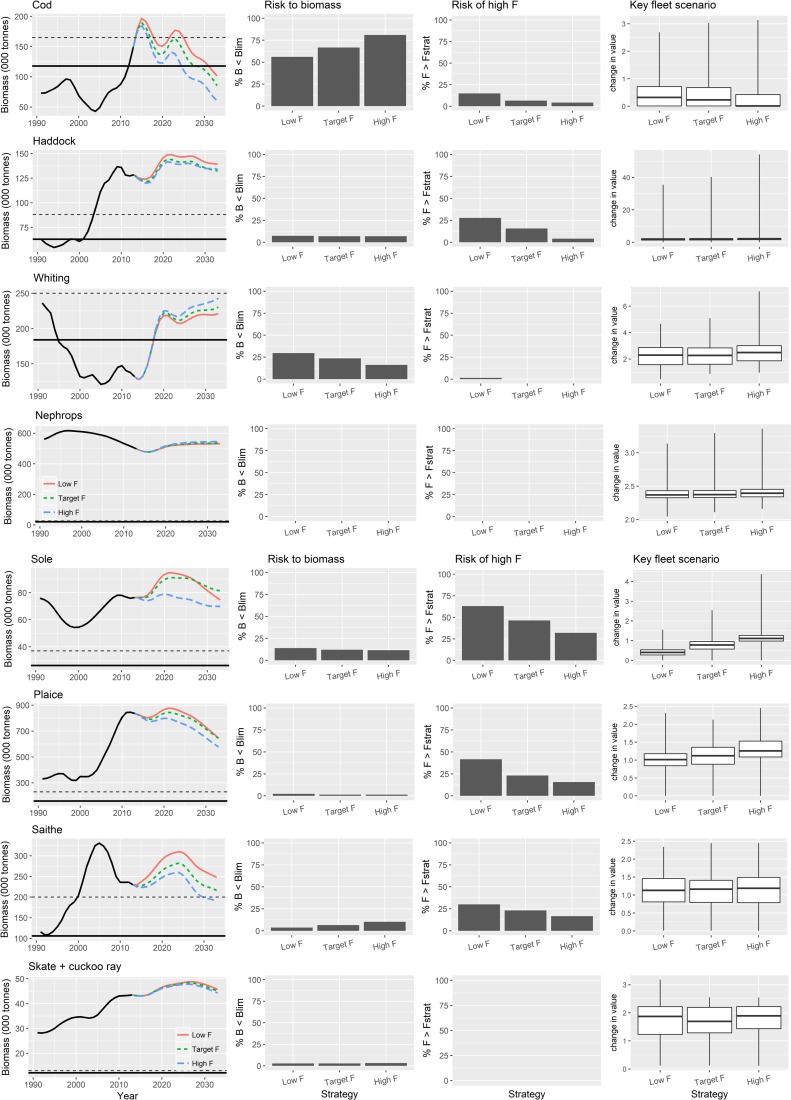
Fig 9. Contrast between fishing effect of ranges in fishing mortality.
Low F (red), high F (green) and Fmsy (blue) implemented with NSMAP strategies with safeguard and using realistic harvest control rule type 4 (see Fig 4) and fishing at target levels by 2020 with discarding continuing. The solid black line in the first column of plots shows Blim and the dotted line MSY Btrigger.

