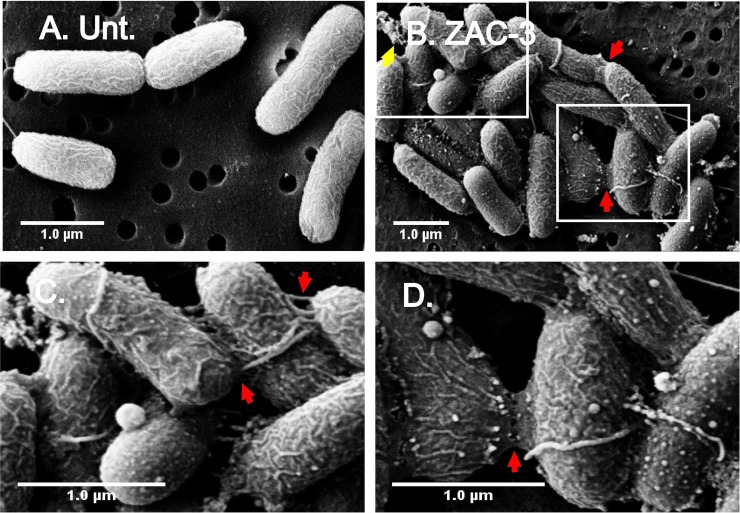
Fig 3. SEM analysis of V. cholerae following treatment with ZAC-3 IgG.
SEM images of V. cholerae O395 treated with (A) medium control, or (B) ZAC-3 IgG (9 μg/mL) for 1 h. The insets in Panel B are shown as panels C and D. Highlighted is evidence of extracellular debris (yellow arrows; panels B) and web-like extensions between cells (red arrows; panels B-D). Scale bars, 1 μm.

