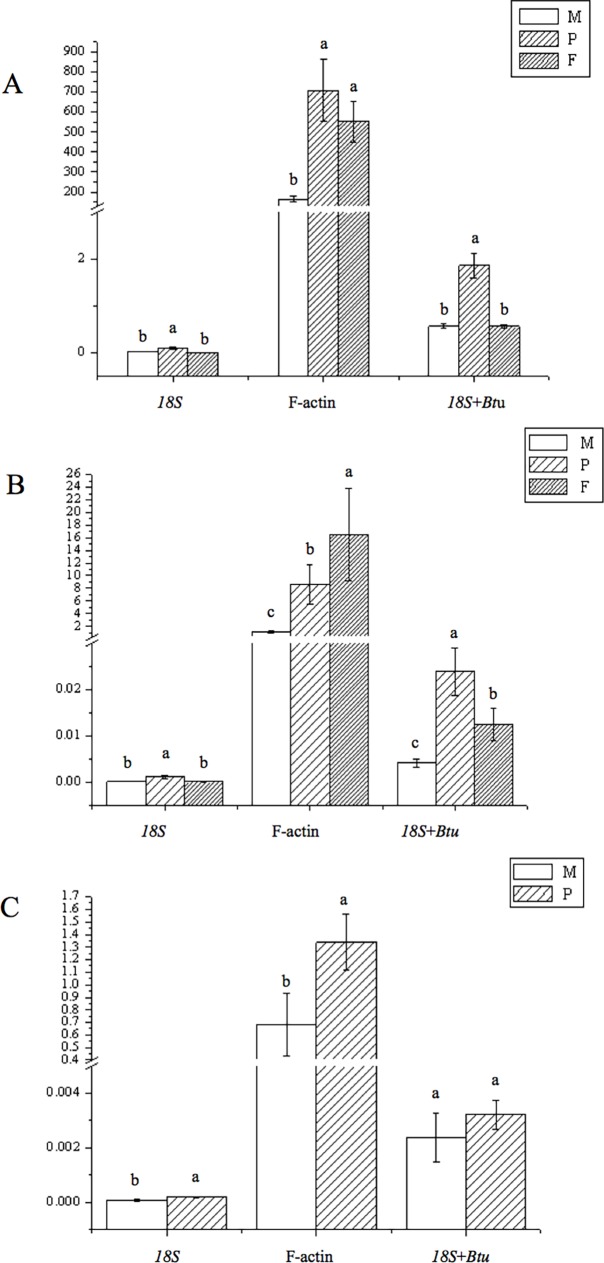
Fig 5.
Relative expression levels of UGPase (A), PGI (B) and PGM(C) among various developmental stages of L. edodes. M: mycelium; P: primordial; F: fruiting bodies. The most stable genes recommended for Development sample (18S and Btu) and the least stable gene F-actin were used for normalization. For 18S and Btu geometric mean was calculated and used for normalization of expression. Error bars show standard deviation calculated from three biological replicates. The relative expression levels of the three genes were indicated as percentage to the expression of candidate reference genes. Different letters above histograms indicate statistical difference highlighted using ANOVA (p-value < 0.05).

