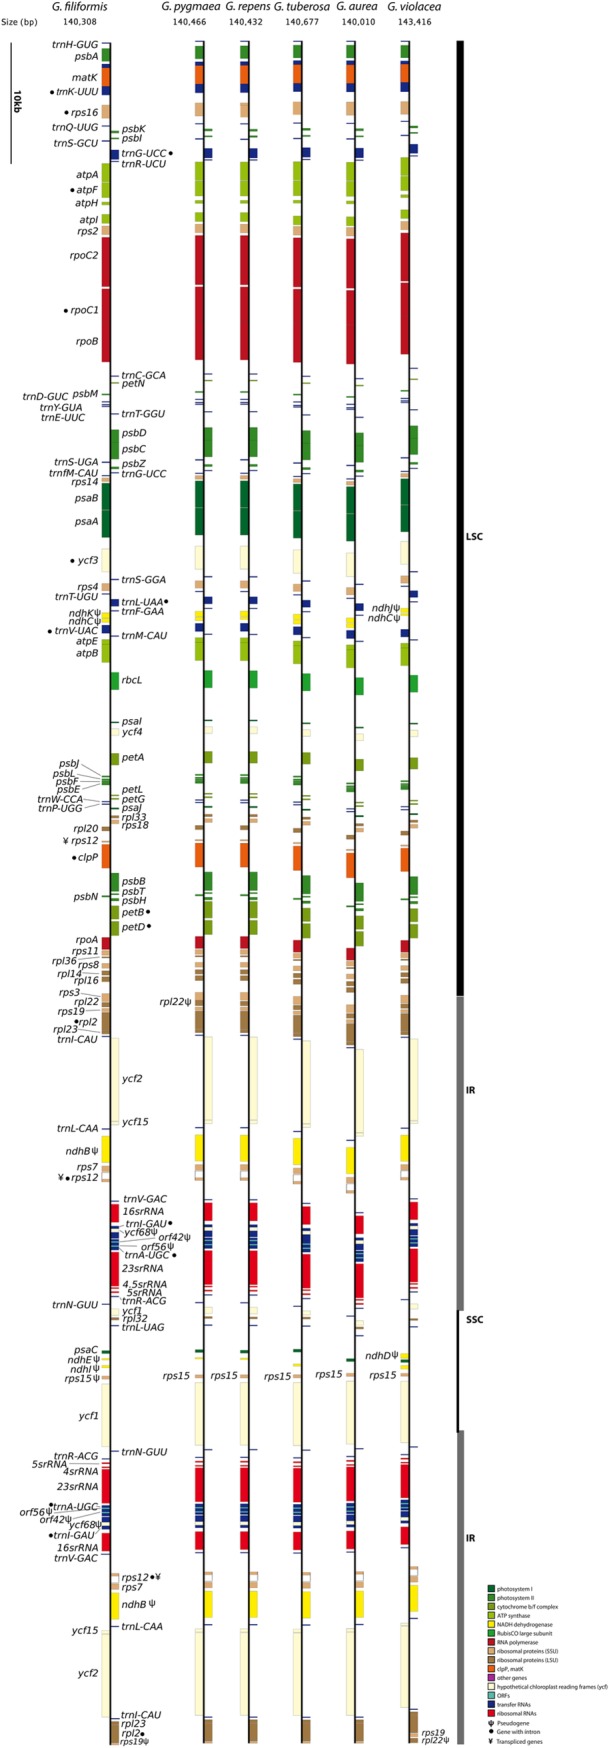
Fig 1. Physical chloroplast genome maps of six assembled Genlisea species.

The chloroplast genome is showed with the genes colorized according to the functional classes for each species. The genes shown on the right side of each cpDNA map are transcribed clockwise, whereas gene on the left side are transcribed counter clockwise. The symbol Ψ after the gene name indicates that is a pseudogene, • the presence of introns and ¥ denotes transpliced genes. Large single copy (LSC), inverted repeats (IR) and single copy repeat (SSC) are represented by the black and grey bars.
