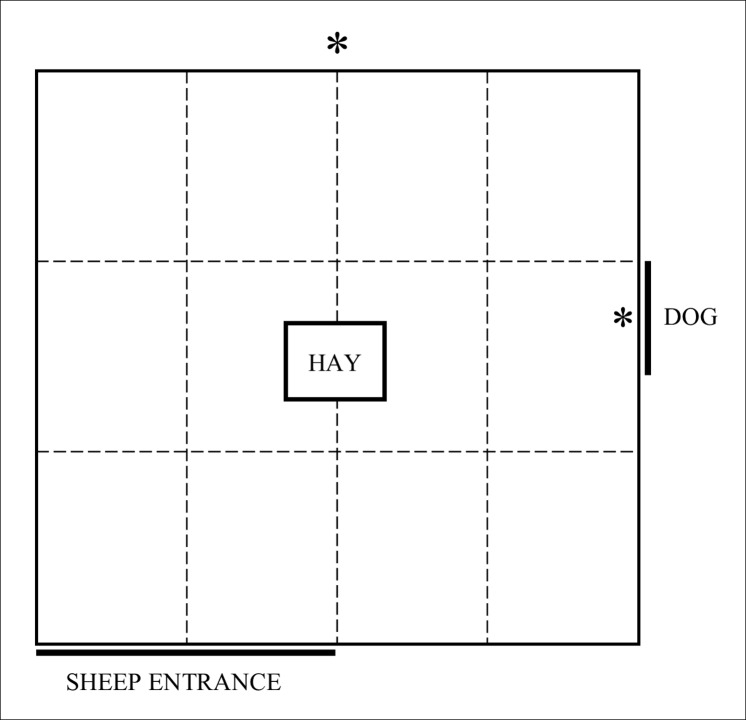
Fig 1. Diagram of the attention bias test arena comprising a 4 x 4.2 m yard with opaque walls 1.8 m high and hay placed in the centre.
Dashed lines represent a 1 x 1.4 m grid painted on the ground. “*” denotes the positions of 2 cameras. A dog was visible for the first 3 s of the test, then the window was covered.

