
Fig 1. Exosome characterization.
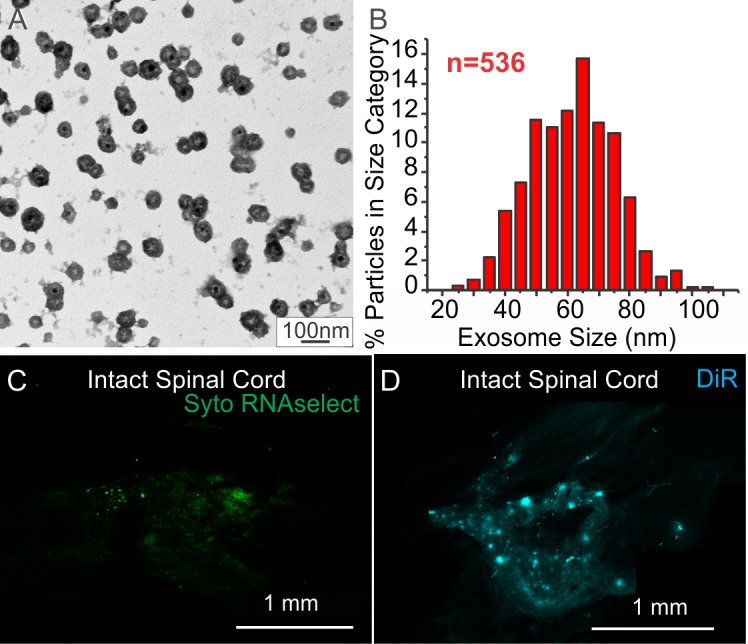
A: Electron micrograph of vesicles in exosome fraction from MSC conditioned media sample on formvar coated grid. B: Histogram of size distribution of 536 presumptive exosomes. Note the average size of the vesicles was 59.09 ± 0.58 nm, consistent with exosomes. C-D: Fluorescence micrographs of intact spinal cord directly injected with exosomes fractions from SytoRNAse (C) and DiR (D) labeled MSCs before perfusion. Note that the presence of detectable levels of 488nm (SytoRNAse) and 650nm (DiR) fluorescence indicates the presence of both RNAs and lipids in the exosome fractions. Scale bar in A indicates 100nm. Scale bars in C &D indicate 1 mm.