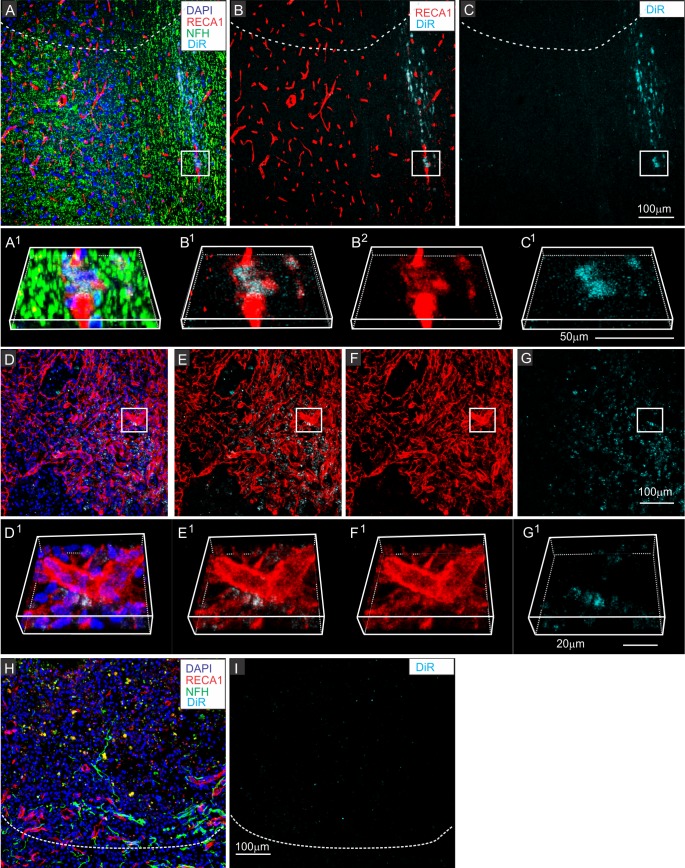
Fig 6. DiR hotspots not detected in other cell types at the lesion site.
Selected regions contused spinal cords 24 hours after infusion of DiR MSCexos (A-G) or PBS with free DiR (G-H), showing close proximity between DiR hotspots and some endothelial cells (A-C) and pericytes (D-G) within the central scar tissue at the contusion site and paucity of DiR fluorescence signal in DiR only infused animal. A-C: Region near the border of the lesion with antibody staining directed against neurofilament (NDH green), the endothelial cell marker RECA-1 (red) (A), RECA-1 (red) and DiR wavelengths (B), or DiR fluorescence only (cyan) (C). A1-C1, B2: enlarged and rotated boxed region shown in A-C. Note that DiR hot spots are very close to the endothelial cells, but not within them. D-G: Selected region in the center of the contusion site containing high concentrations of pericytes Area is shown with antibody staining directed against neurofilament (green), PDGFR-B (red), DiR wavelength fluorescence (cyan) and DAPI counterstaining (blue) (D), PDGFR-B (red) and DiR wavelength fluorescence (cyan) (E), PDGFR-B (red) (F), or DiR wavelength fluorescence only (cyan) (G) D1-G1: enlarged and rotated boxed region shown in D-G. Note that DiR hotspots are located close to pericytes but are not within the pericytes. H-I: Representative region of the lesion in a contused rat infused with DiR only, without exosomes and stained with antibodies directed against RECA-1 (red), and neurofilament (green) and counterstained with DAPI (G) and the same regions showing DiR wavelength fluorescence only. Dashed lines in A-C and H, I indicate the approximate lesion boundary with the lesioned area above and intact spinal cord tissue below. Scale bars in A, G & I = 100μm. C1 50 μm, E1 = 20 μm.

