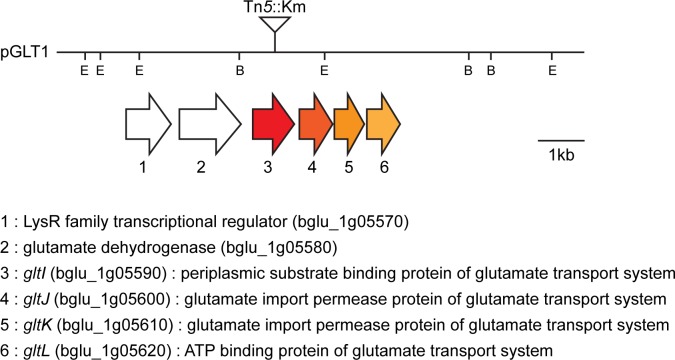
Fig 1. Genetic organization of the gltI gene in B. glumae.
Lanes represent the restriction map of pGLT1 plasmid DNA. Colored arrows below the restriction map represent the schematic organization of the gltI locus. Vertical bars on the map indicate the positions of Tn5 insertions. Genetic information and gene identities were obtained from the B. glumae BGR1 genome database (GenBank accession numbers: CP001503–CP001508). The restriction enzyme sites are indicated as follows: E, EcoRI; B, BamHI.

