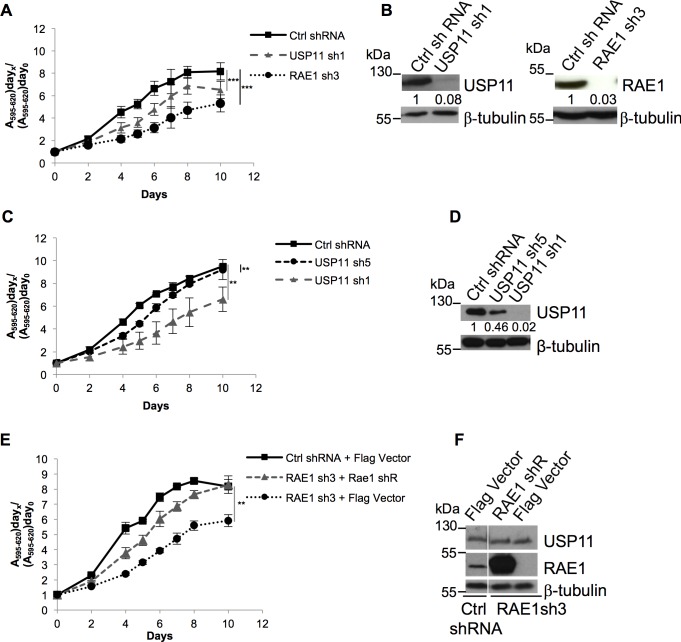
Fig 3. U2OS cell proliferation upon USP11 or RAE1 knock-down.
U2OS cell proliferation measured by MTT. (A) Knock-down of RAE1 or USP11 significantly reduces cell proliferation compared to control shRNA transduced cells (p = 0.0004; p = 0.0004, respectively). (C) MTT cell viability assay measuring cell growth of U2OS cells transduced with control, USP11 sh1 (p = 0.003) or USP11 sh5 (p = 0.0088) shRNA. (E) Back-complementation with RAE1 rescues RAE1 shRNA reduced cell proliferation. RAE1shRNA transduced U2OS cells, back-complemented with shRNA resistant RAE1 (RAE1 shR) partially restores growth rates to the control cells (p = 0.0021 for RAE1sh3 + Flag control compared to RAE1sh3 back-complemented with RAE1). (B, D and F) Western blots illustrating respective protein knock-downs, these are representative for 3 biological replicates. Antibodies used are indicated to the right of each panel. Where blots have been separated by a white line, this indicates that lanes from the western blot, irrelevant to the experiment shown were removed. In panels (B and D) the numbers shown underneath the USP11 and RAE1 western blots indicate the respective normalized protein levels upon knock-down with the different shRNAs compared to control shRNA treated cells. Molecular weight markers are indicated to the left of each western blot. Averages and SEM of three independent transductions and growth curves are shown. P-values were calculated using the two-tailed paired t-test; compared to the control shRNA transduced cells, and are indicated as follows: **: 0.001 < p < 0.01; ***: p < 0.001.

