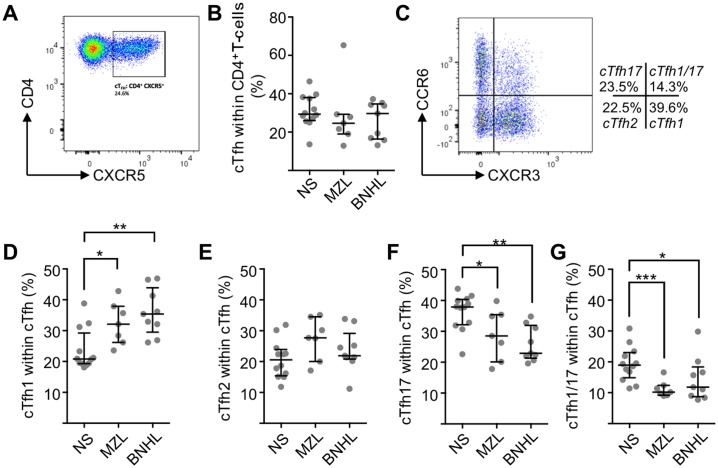
Fig 1. cTfh and cTfh subset proportions in normal subjects and low-grade B-NHL.
(A) After lymphocyte gating and exclusion of doublets, live and CD45RA- cells were identified for further analysis. The biaxial plot shows CXCR5 and CD4 expression from a representative MZL patient. The gate defines CD4+CXCR5+ (cTfh) cells as being 24.6% of total CD4+ T-cells. (B) cTfh cells as a percentage of CD4+ cells in normal subjects (median±SD, 18.9±5.7) and patients with FL (11.8±7.1) and MZL (10.2±2.7). Horizontal lines represent the median and bars represent inter-quartile range. (C) Biaxial flow cytometry plot showing CXCR3 and CCR6 expression on CD4+CD45RA-CXCR5+ cells. Four populations are identifiable: CXCR3+CCR6- (cTfh1), CXCR3-CCR6- (cTfh2), CXCR3-CCR6+ (cTfh17) and CXCR3+CCR6+ (cTfh1/17). (D) cTfh1 cells as a percentage of total cTfh cells. Medians are significantly (Mann-Whitney U-test) different between normal subjects (n = 12, 20.8±6.7%) and lymphoma patients (MZL, n = 7, 32.1±6.8%, P = 0.013 and FL, n = 9, 35.4±7.6%, P = 0.0056). (E) cTfh2 cells as a percentage of total cTfh cells. There are no significant differences between groups. (F) cTfh17 cells as a percentage of total cTfh cells. Medians are significantly different between normal subjects (37.9±5.9%) and lymphoma patients (MZL 28.5±8.2%, P = 0.045 and FL 22.9±5.7%, P = 0.0006). (G) cTfh1/17 cells as a proportion of total cTfh cells. Medians are significantly different between normal subjects (18.9±5.7%) and lymphoma patients (MZL 10.2±2.7%, P = 0.0008 and FL 11.8±7.1%, P = 0.016).

