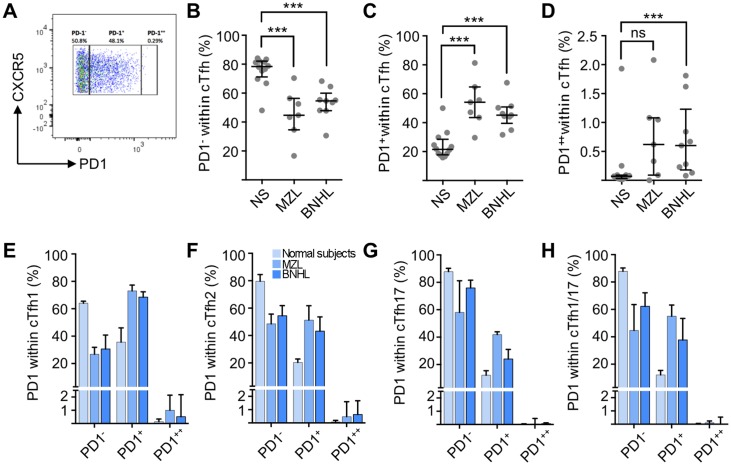
Fig 2. PD1 expression on cTfh subsets.
(A) Biaxial flow cytometry plot showing expression of PD1 and CXCR5 on cells gated for CD4+CD45RA-CXCR5+. Gates defining PD1++, PD1+ and PD1- cells were set by employing human tonsillar T-cells as controls. This representative example from a patient with MZL shows PD1- 50.8%, PD1+ 48.1% and PD1++ 0.29%. (B) PD1- cells as a proportion of total cTfh cells. Horizontal lines represent the median and bars represent inter-quartile range. Medians are significantly (Mann-Whitney U-test) different between normal subjects (n = 12, 78.4% (interquartile range 71.2 to 82.1%) and lymphoma patients (MZL n = 7, 44.7% (34.6 to 56.4%), P = 0.0008 and FL n = 9, 54.6% (47.9 to 60%), P = 0.0016). (C) PD1+ cells as a proportion of total cTfh cells. Medians are significantly different between normal subjects (21.5%, interquartile range 17.8 to 28.6%) and lymphoma patients (MZL 54.1% (43.5 to 64.7%), P = 0.0008 and FL 45.2% (39.5 to 50.9%), P = 0.0003). (D) PD1++ cells as a proportion of total cTfh cells. There is no significant difference between normal subjects (median 0.07%, interquartile range 0.03 to 0.09%) and MZL patients (median 0.62%, interquartile range 0.09 to 1.08%, P = 0.05) but there is a significant difference for BNHL (median 0.6%, interquartile range 0.18 to 1.23%, P = 0.003). Distribution of PD1 expression (PD1++, PD1+ or PD1-) within (E) cTfh1 cells, (F) cTfh2 cells, (G) cTfh17 cells and (H) cTfh1/17 cells.

