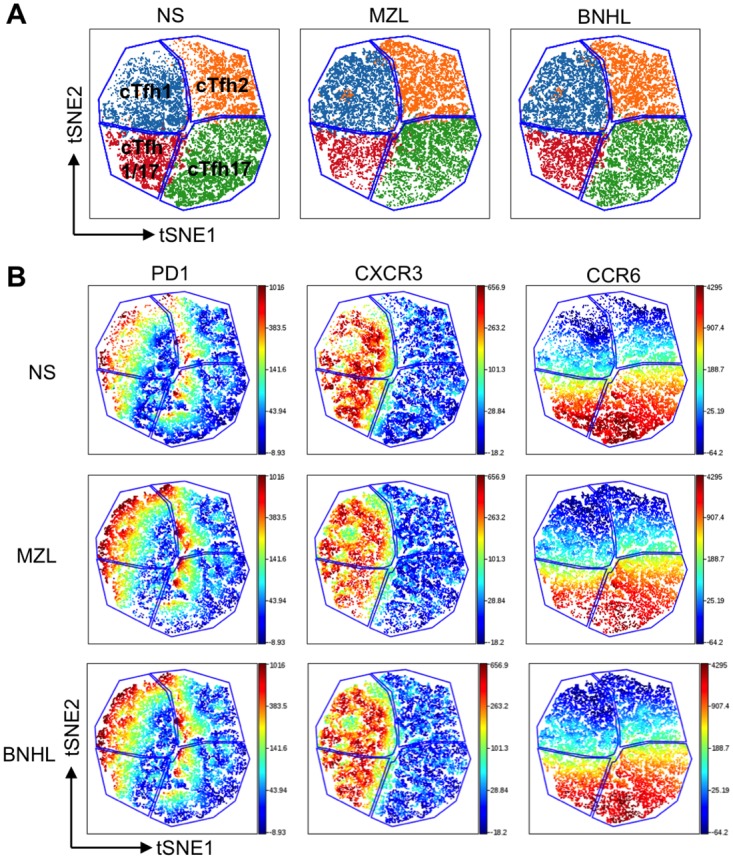
Fig 3. Clustering by ViSNE reveals surface marker expression changes in cTfh subsets.

(A) Comparison of VisNE maps and gating from biaxial flow cytometry plots. Areas within blue lines are derived from the ViSNE maps. Cells coloured according to biaxial plots fro CXCR3 and CCR6 are coloured as shown: cTfh1 (blue), cTfh2 (orange), cTfh17 (green), cTfh1/17 (red). (B) The overall ViSNE map generated for each group is coloured according to the fluorescence intensity of the PD1, CXCR3 and CCR6 channels. Cells were pre-gated to cTfh. Level of expression is according to the bar to the right of the figure with red being highest expression.
