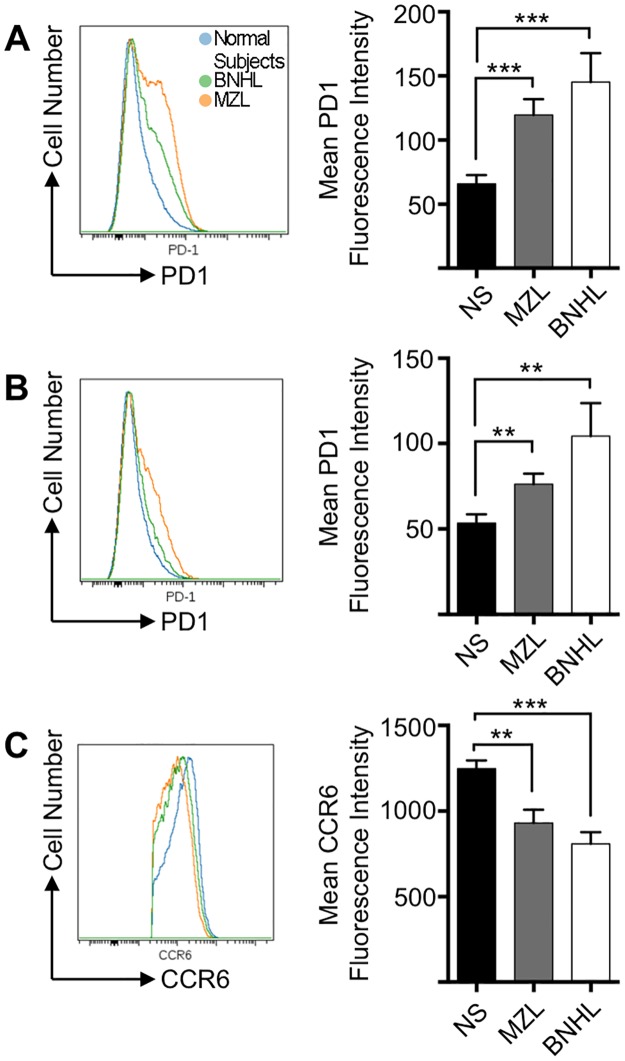
Fig 4. CCR6 and PD1 expression in cTfh subsets.
(A) Concatenated FACS histogram showing superimposed PD1 expression in CD4+CXCR5+ cells from normal subjects (n = 12) and patients with MZL (n = 7) and BNHL (n = 9). The right hand column chart demonstrates PD1 expression (geometric mean fluorescence intensity) for each group (mean±SEM). There are significant increases in PD1 expression in MZL (Mann-Whitney U-test; P = 0.0008) and BNHL (P = 0.0005). (B) FACS histograms showing PD1 expression in CD4+CXCR5+CCR6+ cells from normal subjects and patients with MZL and BNHL. The right hand column chart demonstrates PD1 expression (geometric mean fluorescence intensity) for each group (mean±SEM). There are significant increases in PD1 expression in MZL (Mann-Whitney U-test; P = 0.0052) and BNHL (P = 0.0033). (C) FACS histograms showing CCR6 expression in CD4+CXCR5+CCR6+ cells from normal subjects and patients with MZL and BNHL. The right hand column chart demonstrates PD1 expression (geometric mean fluorescence intensity) for each group (mean±SEM). There are significant decreases in CCR6 expression in MZL (Mann-Whitney U-test; P = 0.0005) and BNHL (P = 0.0035).

