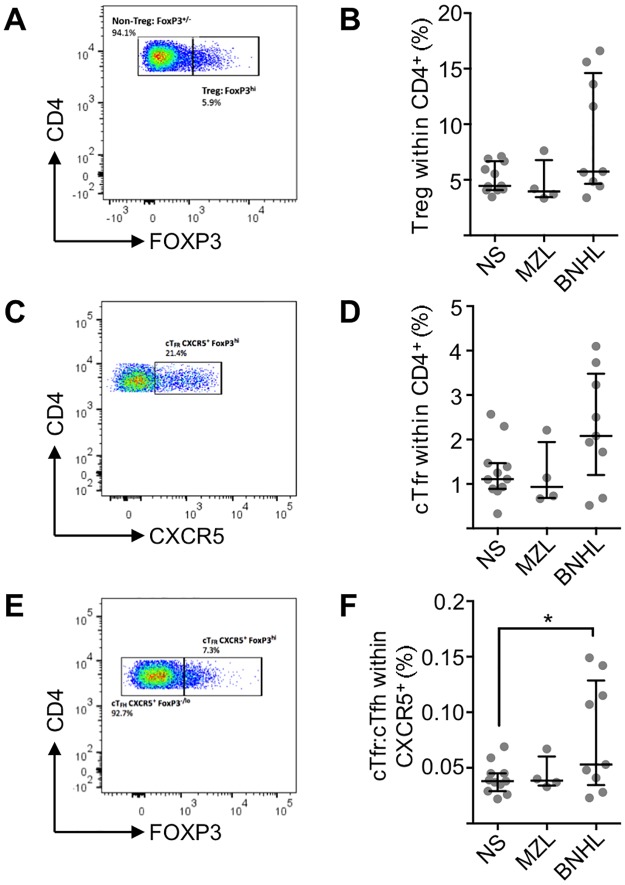
Fig 5. Suppressive Tregs and Tfr in normal subjects and low-grade lymphoma.
(A) Biaxial flow cytometry plot showing expression of CD4 and FOXP3 on cells gated for CD4+CD45RA-. The highest 5% of cells from 11 concatenated NS were employed for the FOXP3hi gate. This representative example from a patient with lymphoma shows Treg 5.9% of CD4+CD45RA- cells. (B) Percentage of Treg within total CD4+ T-cells in normal subjects (n = 11), MZL (N = 4) and BNHL (n = 9). Horizontal lines represent the median and bars represent inter-quartile range. No significant differences were found between groups (Mann-Whitney U test). (C) Biaxial flow cytometry plot showing expression of CD4 and CXCR5 on cells gated for CD4+CD45RA-FOXP3hi. This representative example from a patient with lymphoma shows cTfr 21.4% of CD4+CD45RA-FOXP3hi cells. (D) cTfr as a proportion of total CD4+ T-cells. Horizontal lines represent the median and bars represent inter-quartile range. There are no significant differences between normal subjects (n = 11) and patient with MZL (n = 4) or BNHL (n = 9). (E) Biaxial flow cytometry plot showing expression of CD4 and FOXP3 on cells gated for CD4+CD45RA-CXCR5+. Gates were set by employing human tonsillar T-cells as controls. This representative example from a patient with lymphoma shows cTfr (FOXP3hi) 7.3% and cTfh (FOXP3-/lo) 92.7% of CD4+CD45RA-CXCR5+ cells. (F) cTfr:cTfh ratio. Horizontal lines represent the median and bars represent inter-quartile range. BNHL patients (n = 9) showed a significant difference (Mann-Whitney U-test, P = 0.038) from normal subjects (n = 11) but MZL patients (n = 4) did not.

