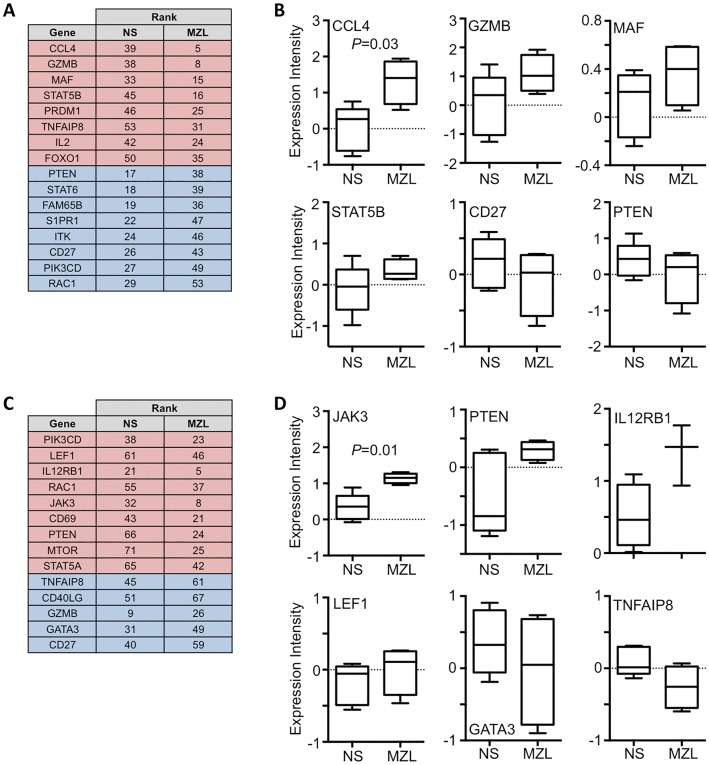
Fig 6. Gene expression changes between normal subjects and MZL patients.
(A) Listing of genes showing the greatest relative change of expression level comparing cTfh PD1+ cells from normal subjects (NS) and patients with MZL. Genes showing an increase in rank in MZL i.e. increased expression are shaded red and those showing a decrease in rank are shaded blue. (B) Box and whisker plot (median, interquartile ranges and 10th and 90th percentile) showing expression levels of CCL4, which differed significantly between cTfh cells of normal subjects and MZL patients (Mann-Whitney U-test, P = 0.03). Examples of non-significant expression level changes are shown for GZMB, MAF, STAT5B, CD27 and PTEN. (C) Relative change in gene expression comparing cTfh1 PD1+ cells from normal subjects (NS) and patients with MZL. Genes showing an increase in rank in MZL i.e. increased expression are shaded red and those showing a decrease in rank are shaded blue. (D) Expression levels of JAK3 differed significantly (Mann-Whitney U-test, P = 0.01) between cTfh1 cells of normal subjects and MZL patients. Examples of non-significant expression level changes are shown for PTEN, IL12RB1, LEF1, GATA3 and TNFAIP8.

