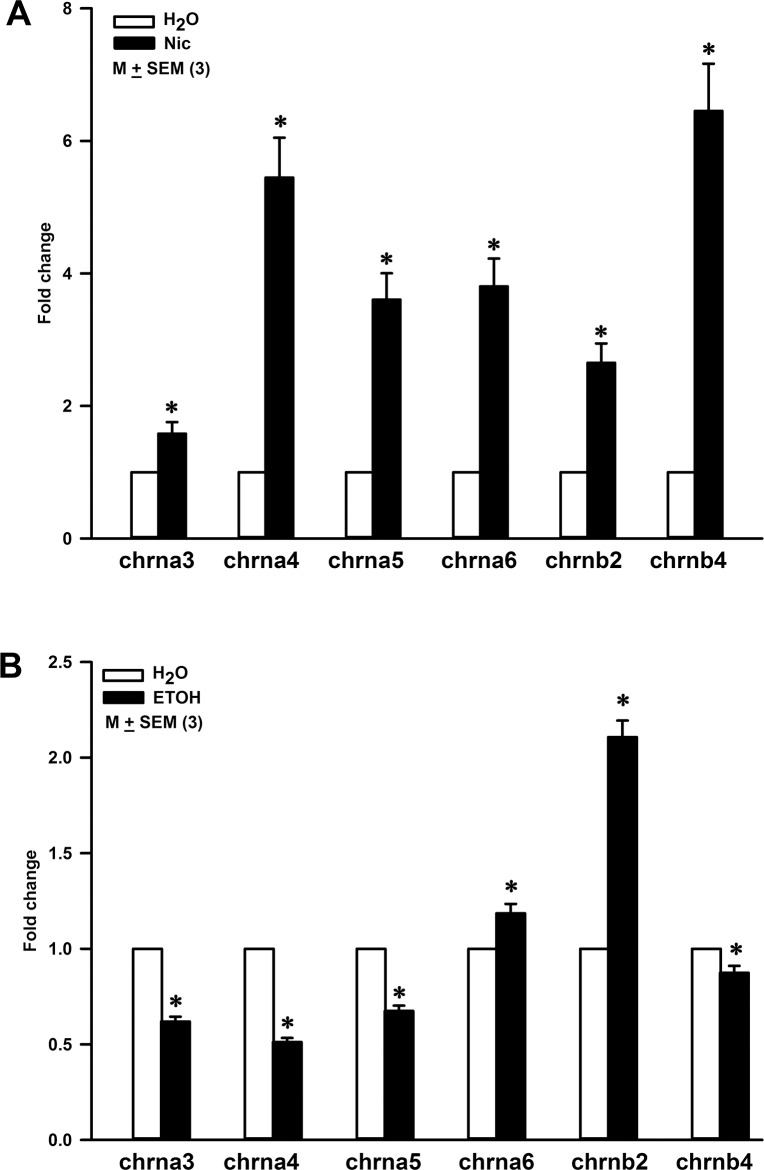
Fig 14. Effect of nicotine (Nic) and ethanol (ETOH) exposure on the nAChR mRNA expression levels in CV taste bud cells in WT mice.
(A) Relative to control WT mice (H2O), in WT mice exposed to Nic (100 μg/ml) for 3 weeks, the p values for fold change in chrna3, chrna4, chrna5, chrna6, chrnb2 and chrnb4 mRNAs were 0.0292, 0.0018, 0.0028, 0.0026, 0.0049, and 0.0016, respectively. (B) Relative to control WT mice (H2O) mice, in WT mice exposed to ETOH (5%) for 3 weeks p values for chrna3, chrna4, chrna5, chrna6, chrnb2 and chrnb4 were 0.0001, 0.0001, 0.0003, 0.0194, 0.0002, and 0.0253, respectively. The values are mean ± SEM of triplicate runs.

