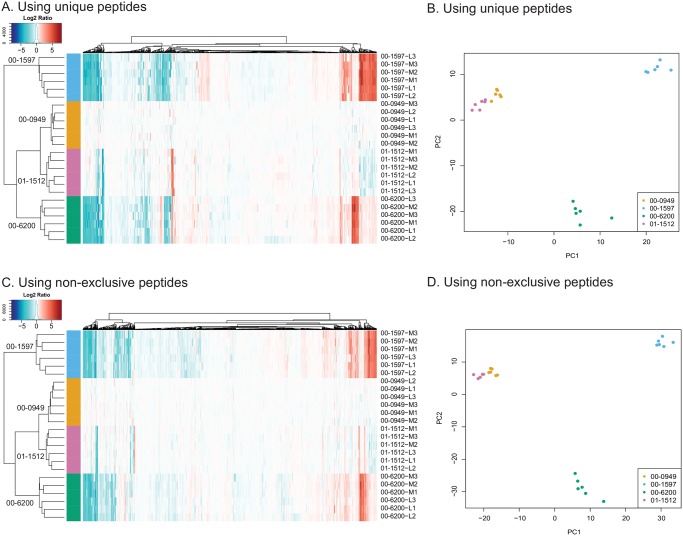
Fig 3. Detection of proteins from each of the four isolates.
A. Heat map comparing relative log2 fold change values of proteins for each isolate using 00–0949 as the reference. Only exclusive peptides were used for analysis in Scaffold. The scale bar shows the relationship of color to log2 fold change values. Labels to the right of each lane identify the isolate and experimental replicate associated with that lane. B. PCA comparing the first two components when only exclusive peptides were used for analysis in Scaffold. C. Heat map comparing relative log2 fold change values of proteins for each isolate using 00–0949 as the reference when non-exclusive peptides were included in the Scaffold analysis. D. PCA comparing the first two components when non-exclusive peptides were included in the Scaffold analysis.

