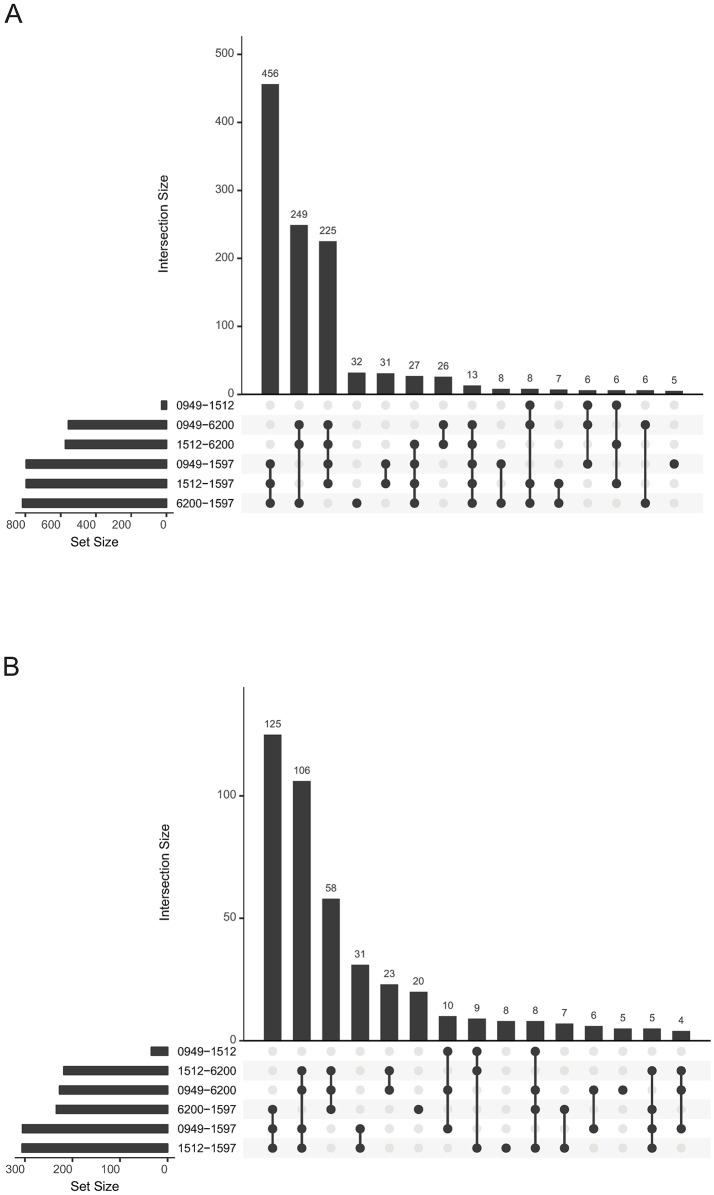
Fig 4. UpSet plots summarizing differential protein expression analysis for the four isolates.
The horizontal bar graph at the bottom left of each figure shows the total number of proteins with differences in log2 fold change expression for each pair of isolates. Joined black circles to the right of these bar graphs indicate that the same differentially expressed proteins were common to the pairwise isolate comparisons shown at left. The vertical bar graph at the top quantitates the number of proteins with similar log2 fold change expression differences in the isolate comparisons. A. Results obtained using only exclusive peptides in the Scaffold pair-wise differential expression analyses. B. Results obtained when non-exclusive peptides were included in the Scaffold pair-wise differential expression analyses. Note the difference in scale between the two bar graphs.

