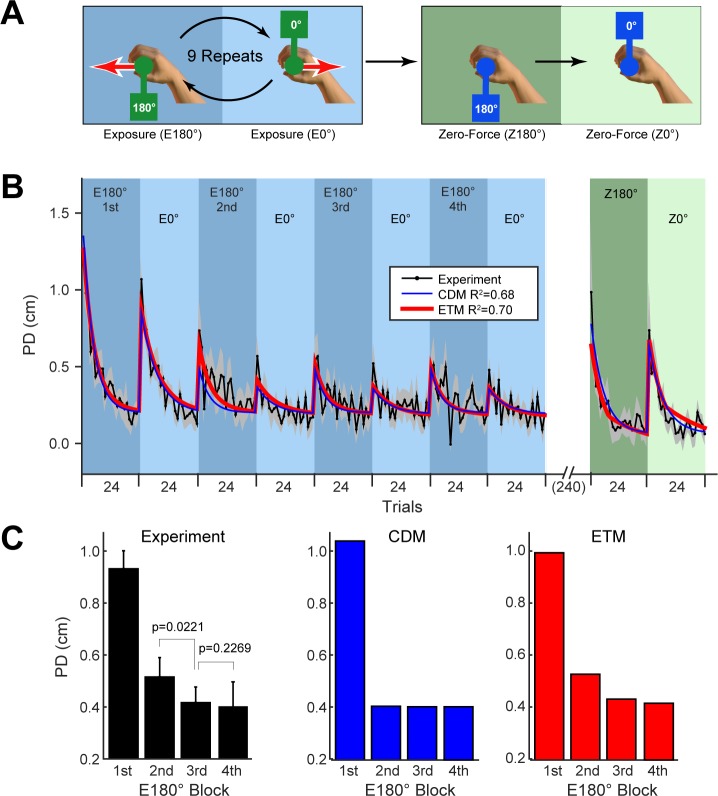
Fig 4. Experiment 3: Opposing dynamics.
A. The paradigm consisted of alternating exposure blocks at 180° and 0° followed by two final blocks of zero-force trials (all blocks consist of 24 trials). B. Trial-series averaged across subjects (grey shading shows ±SE across subjects). Performance was stable from the 5th exposure cycle onwards so we omit exposure blocks after this for clarity. The fits of the models are shown in all panels for the CDM (blue) and ETM (red). C. The PD averaged over each of the first four 180° exposure blocks for the experimental data (error-bars are SE across subjects; p-values are for two-tailed paired t-tests as indicated) and CDM and ETM fits. Experimental data from [3].

