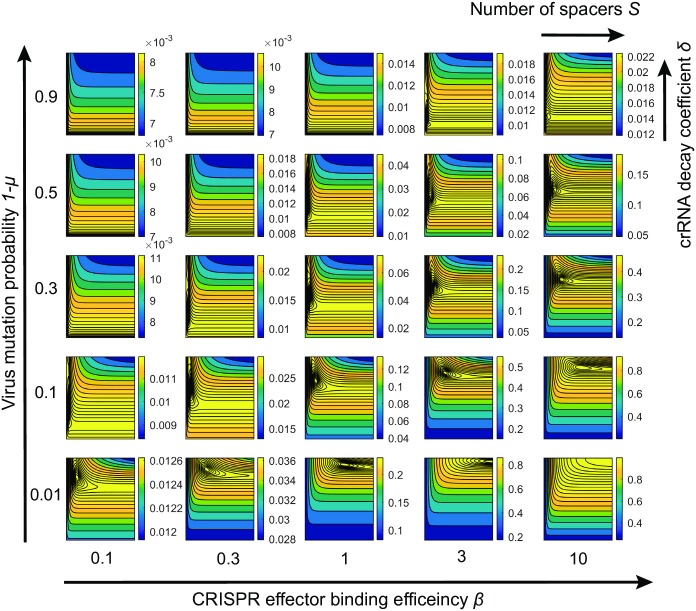
Fig 4. Effects of mutation rate and binding efficiency.
A set of 25 panels illustrating how the survival probability depends on S and δ for various values of protospacer mutation probability 1 − μ and binding efficiency of effectors β. The δ and S axes in each small panel have the same range as in the panel A in Fig 3, while the scale of the heat-map varies and is indicated to the right of each panel. The external axes describe the variation of mutation probability 1 − μ and effector binding efficiency β. In all panels χ = 1.4 and rNt = 5.

