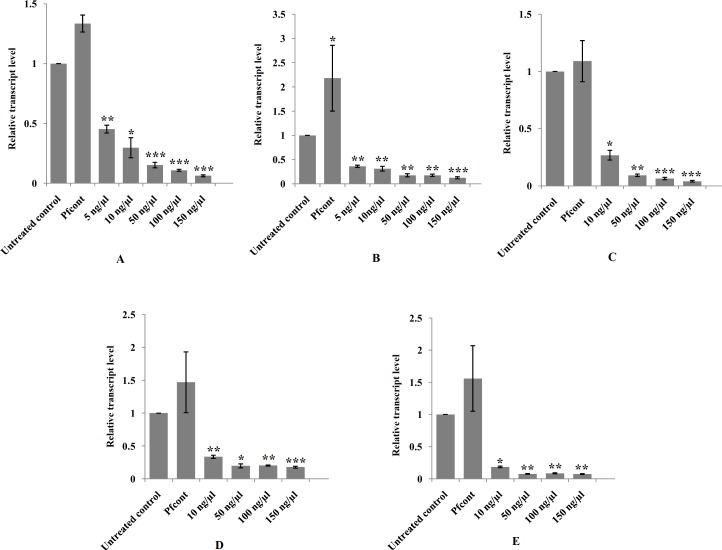
Fig 3.
Relative transcript levels of SOD (A), σGST (B), CatL1-D (C), Cat B1-B3 (D) and Cat B2 (E) genes showing dsRNA concentration dependent suppression of the mRNA transcript at 72 h post-RNAi. Results are presented as the mean ± standard error (SE) of the unit value of 2−ΔΔCt from three independent experiments. P values of ≤0.05 were considered significant. Experiments were repeated ≥3 times. Significant differences between dsRNA treated and untreated control worms are indicated (*, P<0.05; **, P<0.01; ***, P<0.001). (Pfcont = P. falciparum negative control).

