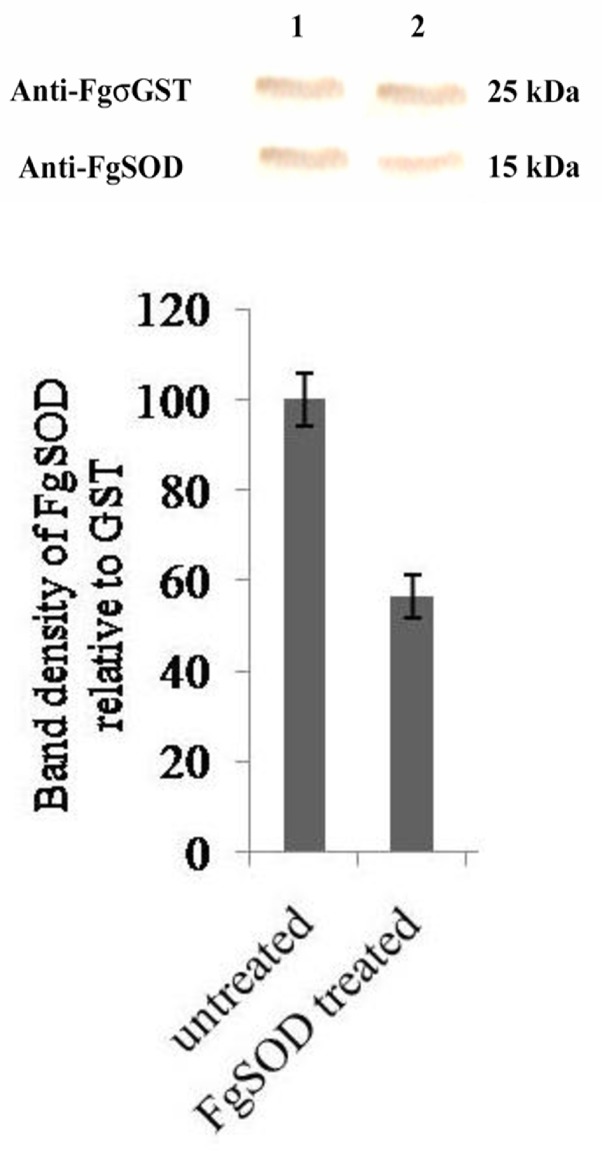
Fig 6. Western blot analysis of F.gigantica SOD protein suppression by SOD specific dsRNA treatment.
Densitometry analysis of protein bands generated by immunoblot of NEJs crude protein extract at 9 days post-exposure to SOD specific long dsRNA. Upper panel: σGST antiserum probed bands (25kDa) in untreated (1) and dsRNA treated flukes (2). Lower panel: SOD antiserum probed bands (15kDa) in untreated (1) and dsRNA treated flukes (2). Bar graphs illustrate densitometric analyses of western blot protein bands, where target band density is normalized to loading control band density and expressed relative to untreated sample (where untreated control = 100%). Statistical significance is indicated relative to the effects of untreated control. Experiments were repeated 3 times. Significant differences between dsRNA treated and untreated control worms are indicated (*, P<0.05; **, P<0.01; ***, P<0.001). Symbols represent mean ±SEM.

