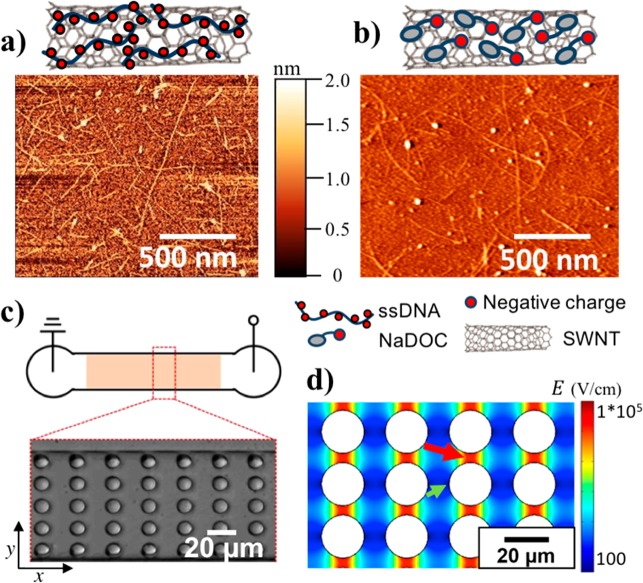
Figure 1.
SWNT characterization and microfluidic device scheme. (a) Schematic drawing of ssDNA-wrapped SWNT and AFM image of ssDNA-suspended single SWNTs. (b) Schematic drawing of NaDOC-wrapped SWNT and AFM image of NaDOC-suspended single SWNTs. (c) Schematic of microfluidic device employed for iDEP and bright field microscopy image of a section of the post array. (d) Electric field distribution as obtained from a COMSOL model in a section of the post array at an applied electric potential of 1000 V across the 1.5 cm long microchannel (green arrow (small), pointing toward the region with the lowest electric field; red arrow (large), pointing toward the region with the highest electric field).

