Figure 3.

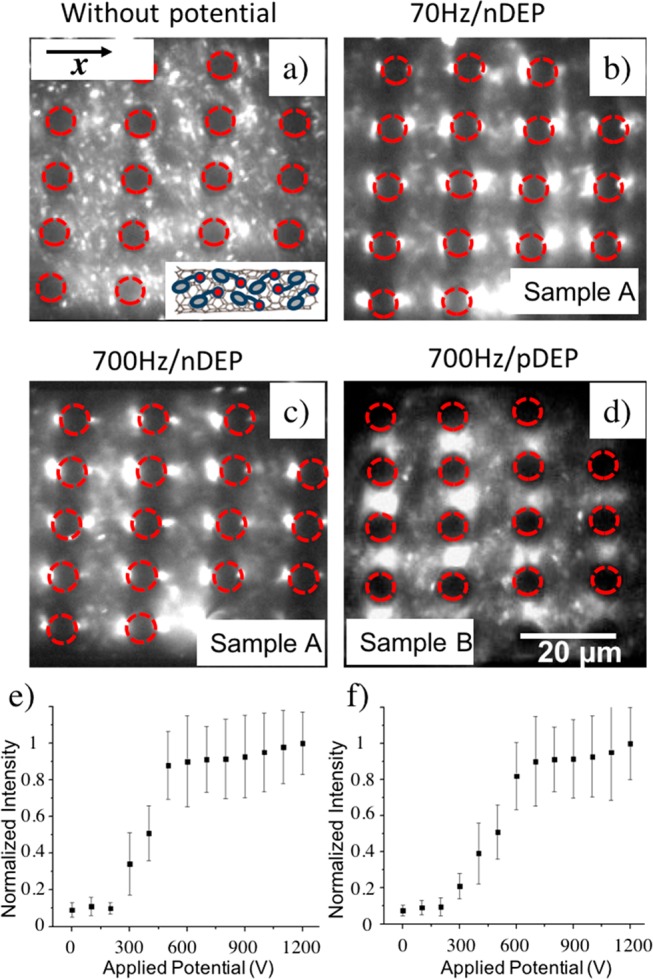
DEP trapping of NaDOC-wrapped SWNTs. IR fluorescence imaging of NaDOC-wrapped SWNTs subject to DEP trapping: (a) without applied potential, no trapping observed; (b) potential of 1000 V applied over the entire microchannel of 1.5 cm length at 70 Hz (external field direction horizontal) for sample A (20 min sonication; SWNTs accumulated in the regions of lowest electric field strength consistent with nDEP); (c) same as panel b but at 700 Hz (SWNTs still accumulated in the regions of lowest electric field strength consistent with nDEP); (d) for sample B, SWNTs (60 min sonication) accumulated in the regions of highest electric field strength, consistent with pDEP (scale bar, 20 μm for panels a–d). Normalized fluorescence intensity indicative of DEP trapping vs applied electric potential: (e) for sample A in the regions where nDEP occurs; (f) similar to panel e but with sample B for pDEP trapping regions.
