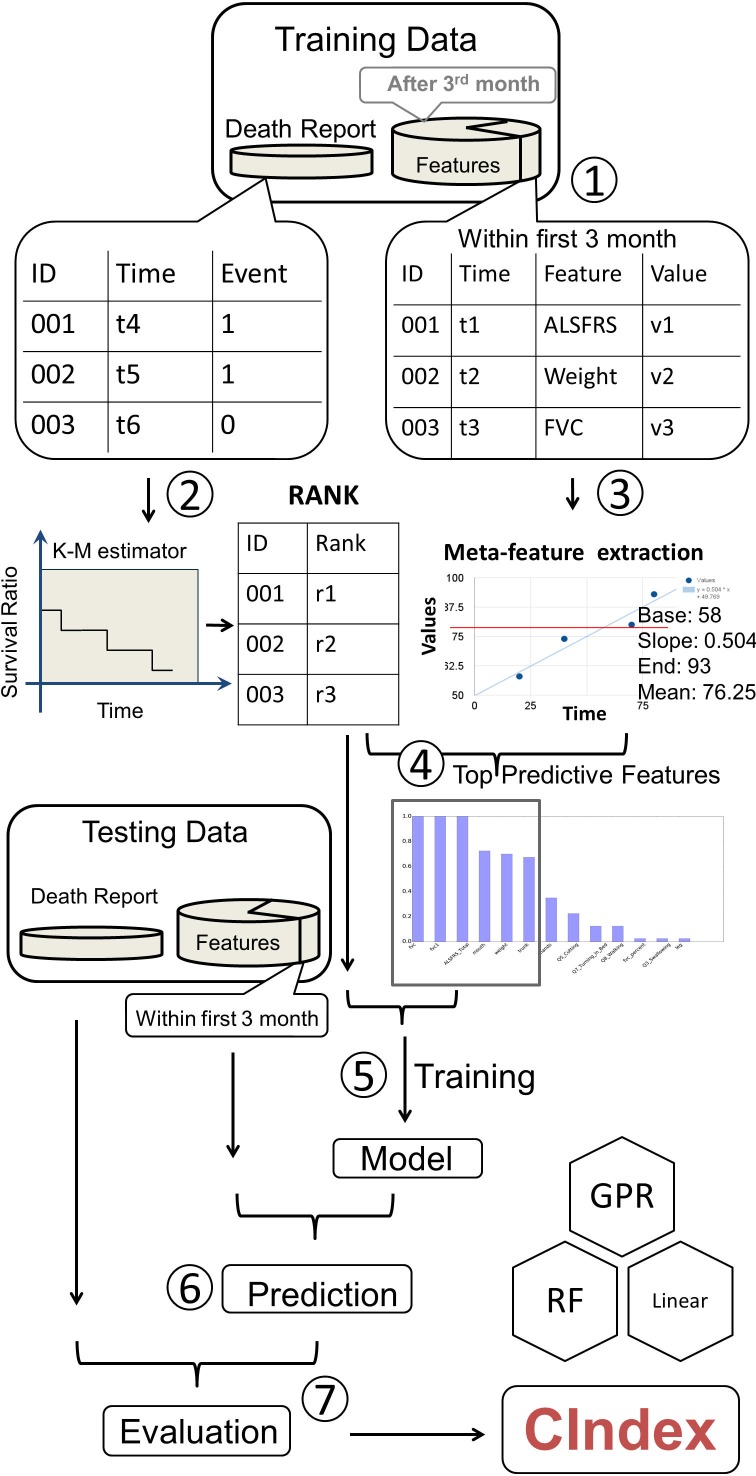
Fig 1. Workflow.
Data were randomly divided into training and testing datasets for both survival status and clinical features. Because the challenge evaluation used first 3-month data as the prediction input data, only the features recorded during the first 3 months of patient enrollment in the trial were included in the data training features. (Step 1) Using the survival data, and K-M estimator, we ranked all the individuals and assigned each one ranking score. (Step 2) Each feature was further extracted to four meta-features. (Step 3) After calculating the correlation between the meta-features and survival results, we chose the top related features to be counted as the training and testing data. (Step 4) The training ranking was set as the training target to generate the model. This model was subsequently applied to the testing features for prediction. The prediction results were compared to test death report data for concordance Index shown as ‘C’ in the figure (right bottom).

