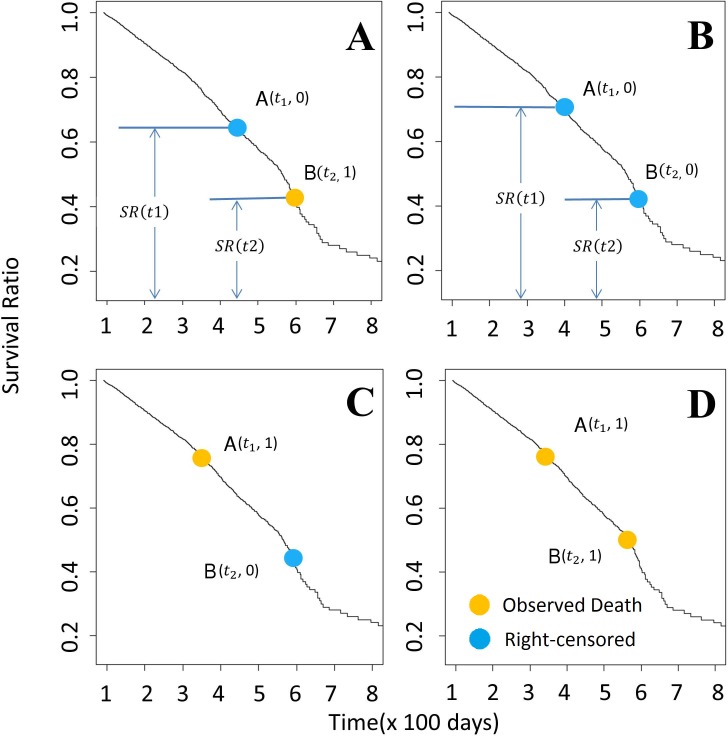
Fig 6. Ranking method based on the Kaplan-Meier estimator.
Each panel above represents the pair-wise comparison between two participants. To compare two Patients A(t1) and B(t2), assuming t1 < t2, there are four possibilities (as shown in 6A-6D). (A) Survival time is known for patient B but is censored for patient A. The probability of patient A dying between t1 and t2 is ρt1,t2 (ρt1,t2 = )). In this case, we add ρt1,t2 to rank of patient A, and (1- ρt1,t2) to B. (B) Survival status for patients A and B are both censored. The probability of patient A dying between the time t1 and t2 is represented by ρt1,t2. Due to the uncertainty of the both A and B, we assume that after time point t2, A and B are equally likely to survival longer than another, with the possibility of P = (1 − ρt1,t2)/2. Therefore, ρt1,t2 + (1 − ρt1,t2)/2 and (1 − ρt1,t2)/2 are added to the rank of A and B here, respectively. (C & D): Patient B survives longer than patient A, 1 is added to the rank of A. Yellow dots = death event of completely observed samples; Blue dots = last observation of right censored samples.

