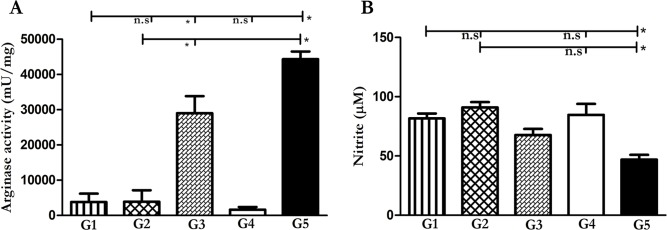
Fig 5. Evaluation of arginase activity and NO production in mice treated with different HNP1 modalities.
Arginase activity (mU/ml) and nitrite production were determined in footpad and spleen (n = 5), respectively. Arginase activity (A) was performed by micro method test and NO (B) was fulfilled by Griess test. In both tests, the G1-G5 represents the results from folded HNP1 (G1), pcDNA-HNP1-EGFP (G2), pcDNA-EGFP (G3), AmB (G4) and non-treated group (G5), respectively. The star displays significant difference and n.s indicates not significant.

