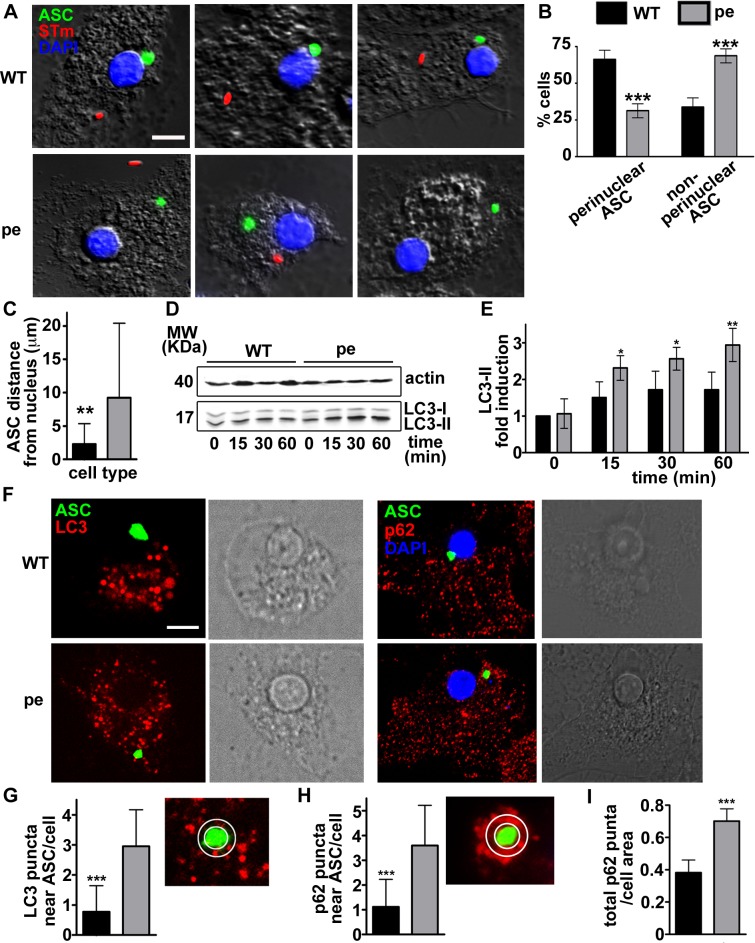
Fig 5. AP-3 is required for perinuclear inflammasome positioning and limits autophagy induction after Salmonella Typhimurium infection in DCs.
(A-C). WT and pearl (pe) BMDCs expressing ASC-GFP were infected with flagellin-expressing mCherry-STm (stimulates NLRC4). Cells were fixed 1 h after infection, labeled with DAPI and analyzed by fluorescence microscopy. A. Representative images showing ASC speck (green) relative to STm (red) and nucleus (blue) in four infected WT and pearl DCs each. B. Quantification of perinuclear (within a radius of one μm from the nucleus) and non-perinuclear ASC specks in 20 cells per cell type in each of four independent experiments. C. Quantification of ASC speck distance to the nucleus in 15 cells per cell type in each of three independent experiments. (D, E). WT and pearl BMDCs were infected with STm, and endogenous LC3 (and actin as a control) was detected by immunoblotting fractionated cell lysates at the indicated time points. D. Representative blot with positions of molecular weight markers (MW) indicated at left. E. Quantification of LC3-II band intensities from three independent experiments, expressed as fold increase relative to unstimulated cells and normalized to LC3-I and β-actin levels. (F-I). WT and pearl BMDCs expressing ASC-GFP alone or with mCherry-LC3 were infected with STm and analyzed by live fluorescence imaging (for LC3) or fixed immunofluorescence microscopy (for p62) 1 h later. F. Representative images showing ASC speck (green) and either LC3 puncta (red, left panels) or endogenous p62 puncta (red) and nuclei (blue; right panels) in infected cells. Corresponding DIC images show nuclear position. G, H. Quantification of LC3 (G) or p62 (H) puncta within a radius of 0.5 μm from the ASC speck (representative image shown at right) in 15 cells per cell type in each of 3 independent experiments. I, Quantification of total p62 puncta normalized to cell area. Data represent mean ± SD. Scale bar: 10 μm.**p<0.01; ***p<0.001. See also S5and S6 Figs.

