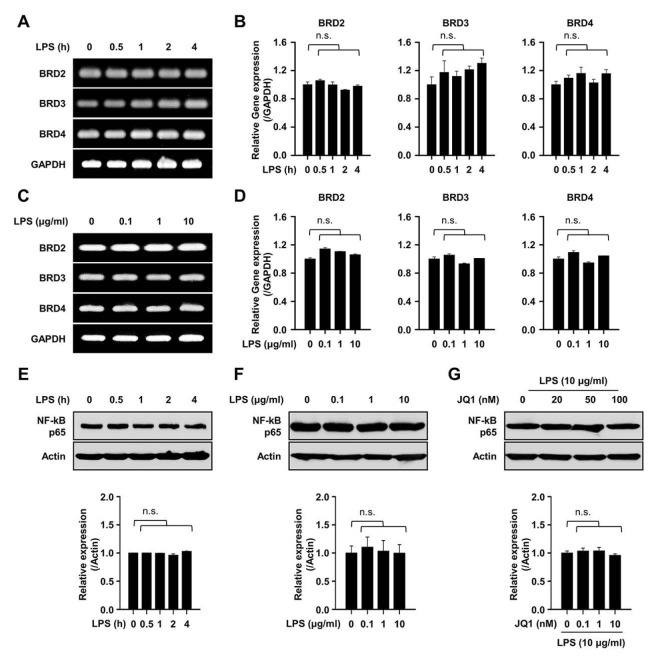
Fig. 3.
Expression of BET proteins and NF-κB in LPS stimulated B cells. (A and B) Splenic B cells were stimulated by 10 μg/ml of LPS for indicated times (0–4 h). (A) Representative image of BET (BRD2, BRD3, and BRD4) genes and (B) relative gene expression level of BET proteins in a time dependent manner. (C and D) Splenic B cells were stimulated by indicated doses (0–10 μg/ml) of LPS for 4 h. (C) Representative image of BET (BRD2, BRD3, and BRD4) genes and (D) relative gene expression level of BET proteins in a dose dependent manner. Representative images (A, C) and data (B, D) are the mean ± SEM from three independent experiments. n.s., not significant. (E and F) Cells were stimulated by indicated doses (0–10 μg/ml) of LPS for indicated times (0–4 h). Representative band image and relative protein expression level of NF-κB in LPS stimulated B cells. (G) Representative band image and relative protein expression level of NF-κB in LPS stimulated B cells in the presence of the indicated dose of JQ1 for 4 h. Representative band images and data are the mean ± SEM from three independent experiments. n.s., not significant.

