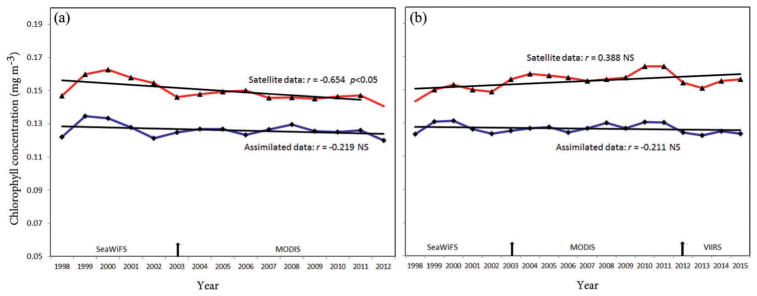
Figure 3.
Global annual median chlorophyll from 2013/2010 version processing (a) and 2015 revision (b). The more recent version includes 3 more years, for a time series record length of 18 years (1998–2015). Arrows indicate the year of switch in sensors for the time series. The missing markers for the satellite data trend in the earlier version (a) and the revision (b) indicate end-point bias removal. These are the lowest values in the respective time series. The trends are computed without these data, with associated reduction in degrees of freedom. r is the correlation coefficient, p is the probability, and NS indicates not statistically significant at p < 0.05.

