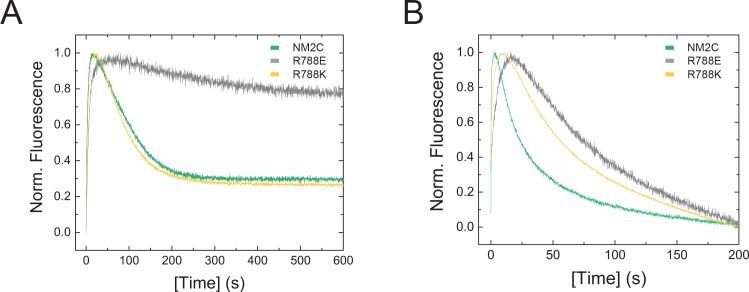
(
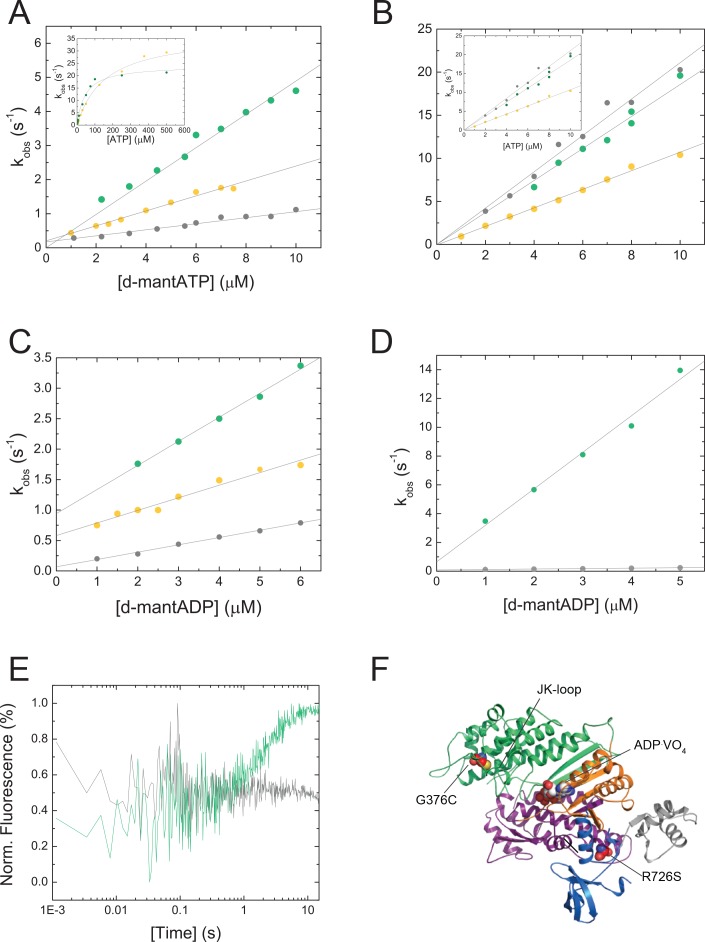
A) Dependence of the observed rate constants (
kobs) upon d-mantATP binding to 0.25 µM NM2C/R788K/R788E on the nucleotide concentration. Linear fits to the data result in second-order binding rate constants of
K1k+2 = 0.48±0.01 µM
−1s
−1 for NM2C (green), a two-fold reduced ATP binding constant
K1k+2 = 0.22±0.01 µM
−1s
−1 for R788K (yellow), and a five-fold reduced binding rate constant of
K1k+2 = 0.09±0.005 µM
−1s
−1 for R788E (grey) compared to NM2C.
Inset, The rate constants (
kobs) obtained from the binding reaction of ATP to NM2C/R788K dependent hyperbolically on the ATP concentration. The rate of ATP hydrolysis (
k+3+
k-3) and the second-order binding rate constants
K1k+2 were determined from a fit to the data (NM2C:
k+3+
k-3=24.32 ± 0.89 s
−1;
K1k+2 = 0.39±0.01 µM
−1s
−1; R788K:
k+3+
k-3=37.31 ± 0.55 s
−1;
K1k+2 = 0.18±0.01 µM
−1s
−1). The respective parameters are not experimentally accessible for R788E. (
B) The apparent second-order ATP binding rate constants, determined by the ATP-induced dissociation of the pyrene-labeled actoNM2C (green) or actoR788E (grey) complexes are with
K1k+2 = 1.86±0.03 µM
−1s
−1 and
K1k+2 = 2.11±0.05 µM
−1s
−1 similar. The respective constant is reduced to
K1k+2 = 1.03±0.03 µM
−1s
−1 for actoR788K (yellow).
Inset, The maximum isomerization rate constants
k+2 = 643.06±22.6 s
−1 (NM2C),
k+2 = 767.43±21.27 s
−1 (R788K), and
k+2 = 579.27±12.81 s
−1 was determined from a hyperbolic fit to the respective data. (
C) The R788K (yellow) and the R788E (grey) mutation decrease the second-order ADP-binding rate constant two- to threefold to
k+D = 0.21±0.02 µM
−1s
−1 and
k+D = 0.12±0.01 µM
−1s
−1 when compared to
k+D = 0.39±0.01 µM
−1s
−1 for NM2C (green). (
D) The ADP-binding rate constant
k+AD = 0.03±0.001 µM
−1s
−1, as calculated from the slope of the
kobs versus [d-mantADP] plot, is 85-fold decreased for R788E (grey) when compared to
k+AD = 2.54±0.18 µM
−1s
−1 for NM2C (green). (
E) Time-dependent change in the intrinsic tryptophan signal upon mixing 0.5 mM ATP with 0.25 µM NM2C (grey) or R778E (grey) in the presence of 5 µM ADP. ATP binding increases the fluorescence signal in NM2C but not R788E under identical conditions in a stopped-flow spectrophotometer. (
F) Missense mutations G376C and R726S are associated with autosomal dominant hearing impairment (DFNA4) and their location in NM2C is shown in spheres representation. G376C is in proximity to the JK-loop, R726S is in the SH1-SH2 helix. NM2C subdomains are color coded according to
Figure 1C and the nucleotide is shown in spheres representation.


