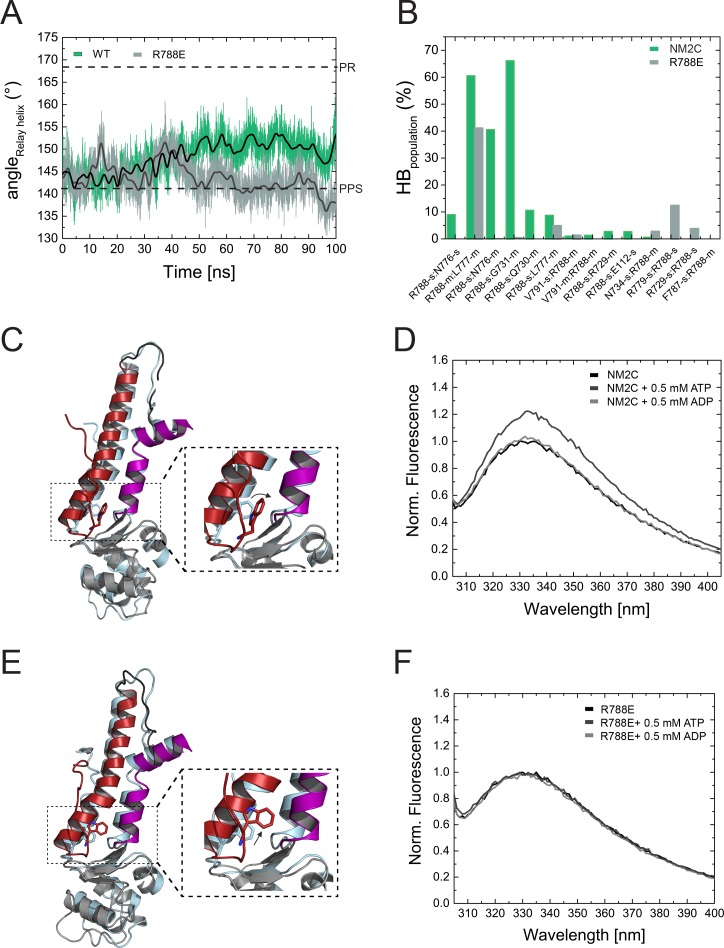
Figure 5. Structural importance of R788 at the converter/Nter/lever junction.
(A) Relay helix angle as a function of MD simulation time, as monitored by the angle between Cα atoms of residues S489, M510, and E521 along the trajectories. The relay helix straightens in NM2C with a steady increase in the angle of the relay helix from approximately 145° to 150°, while the angle does not change significantly in R788E and fluctuates around 145° throughout the 100 ns time course of the simulation. Values for the relay helix angle observed in crystal structures of pre-power stroke (PPS) and post-rigor (PR) are indicated by dotted lines. (B) Population of hydrogen bonds (HB) between R788 (NM2C) or E788 (R788E) and surrounding structural elements over the simulation time of 100 ns. The abbreviations s and m indicate side chain and main chain. (C) Dynamics and conformational changes in NM2C during MD simulations. Snapshots from the start (0 ns simulation time) and end conformations (100 ns simulation time) are shown in light cyan and colored cartoon representation, respectively. The relay helix is shown in red, the SH1-SH2 helix in purple and the converter in grey. Relay loop W525 is shown in red in stick representation. The insets show a close-up view of the conformational changes of W525 along the simulation trajectory. (D) Tryptophan fluorescence emission spectrum of 4 µM NM2C in the absence of nucleotide or the presence of 0.5 mM ATP or 0.5 mM ADP. (E) Dynamics and conformational changes in R788E during MD simulations. Snapshots from the start (0 ns simulation time) and end conformations (100 ns simulation time) are shown in light cyan and colored cartoon representation, respectively. The relay helix is shown in red, the SH1-SH2 helix in purple and the converter in grey. Relay loop W525 is shown in red in stick representation. The insets show a close-up view of the conformational changes of W525 along the simulation trajectory. (F) Tryptophan fluorescence emission spectrum of 4 µM R788E in the absence of nucleotide or presence of 0.5 mM ATP or 0.5 mM ADP.


