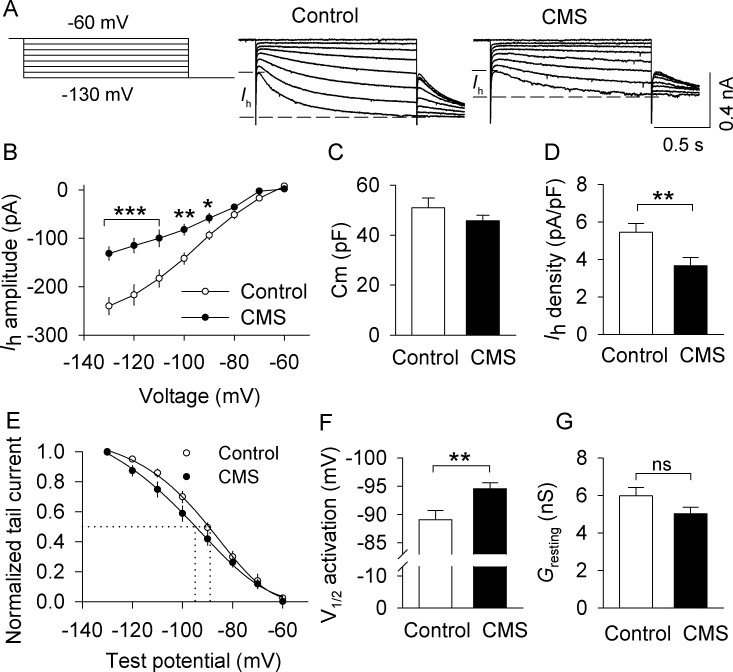
Figure 4. CMS decreased Ih currents in VTA dopamine neurons that project to the lateral shell of the NAc (LAcbSh).
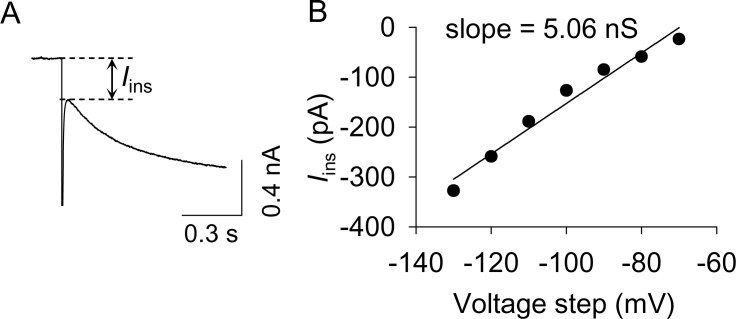
(A) Left: Voltage protocol for recording Ih current. Right: Representative Ih current recorded from NAc-projecting VTA dopamine neurons in control and CMS mice. (B) Compared with the control group, Ih amplitude was significantly decreased in the CMS group at corresponding hyperpolarization potentials (*p<0.05, **p<0.01, ***p<0.001, control, n = 15 cells from five mice; CMS, 13 cells from three mice from B to G). Ih amplitude was calculated by subtracting the instantaneous current from the steady-state current achieved during the voltage step. (C) The membrane capacitance (Cm) was not significantly different between control and CMS mice (p=0.273). (D) Ih current density was significantly decreased in the CMS group compared with the control group (**p=0.009). (E) Ih activation curves in the control and CMS groups generated by the tail current protocol. Tail current amplitudes were fitted with a Boltzmann function. (F) CMS led to a significant hyperpolarizing shift of the half-activation potential (V1/2) compared with that of control (**p=0.007). (G) The resting membrane conductance (Gresting) was not significantly different between control and CMS mice (p=0.107).


